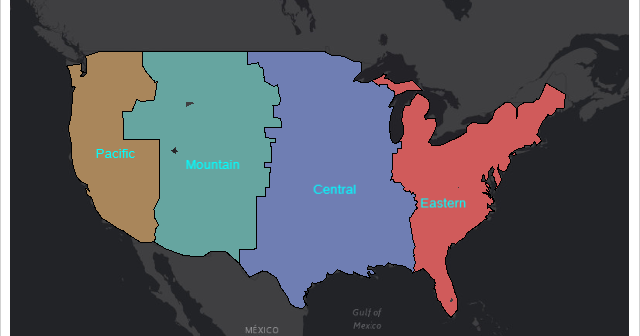
Starting with SAS 9.4M6, procedures that used to be provided with a SAS/GRAPH installation are now available with Base SAS. Using these procedures along with PROC SGMAP can help you create some very nice maps. This blog builds on previous posts and highlights the: MAPSSAS Data Sets GREMOVE procedure %CENTROID
Tag: ODS Graphics
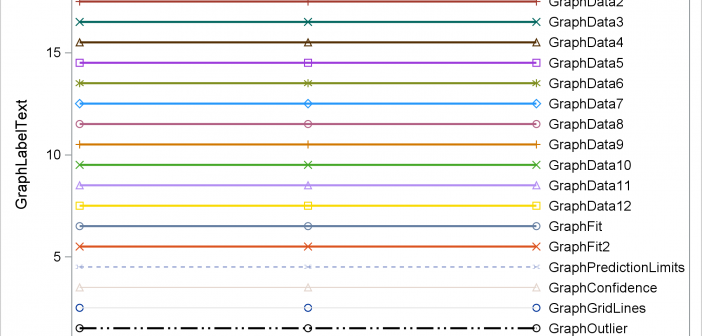
Have you ever wanted to see examples of all of the output styles that SAS provides? You can run a program and look at the resulting file, styles.html. This post explains more about the styles that you will see including a discussion of attribute priority.
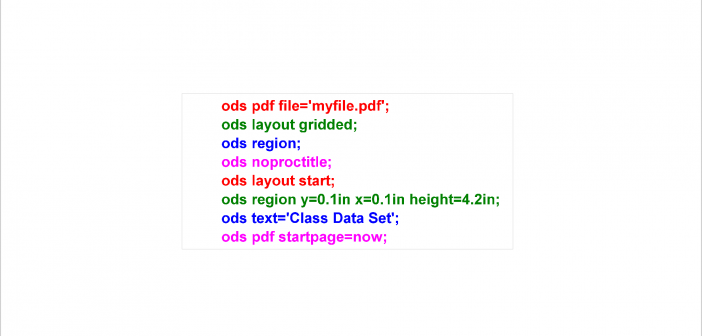
PROC SGPLOT displays titles inside the graph. If you want to display a title inside the graph and a different title outside the graph, you can use the ODS LAYOUT or the GTL. The ODS LAYOUT gives you precise control over your output and enables you to display multiple graphs and tables in each page.
This post presents some basic aspects of ODS Graphics: enabling, selecting, and displaying graphs.
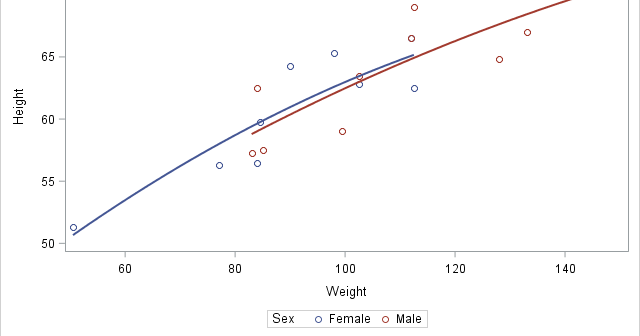
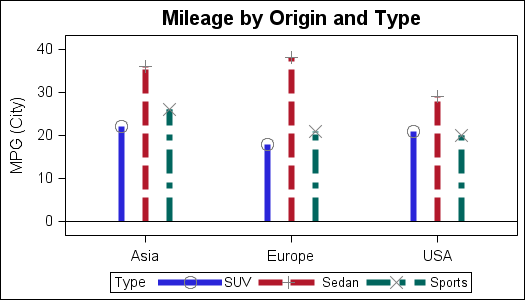
In this post, I will show you how to control the order of the entries in a legend and explicitly control the correspondence between groups and style elements in PROC SGPLOT. In many cases, the colors that are used to differentiate groups do not matter--the graph simply needs to display
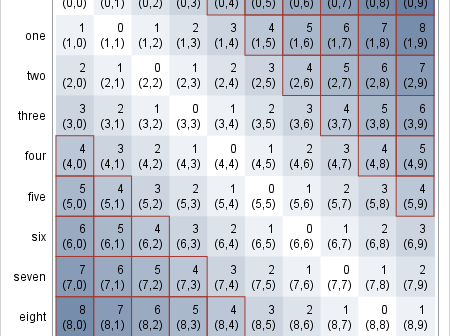
There are many ways to use a heat map. For big data sets, heat maps provide a substitute for scatter plots. Heat maps can also be used to enhance small tables. Several of my colleagues (Sanjay Matange, Pratik Phadke, Rick Wicklin, Chris Hemedinger, and probably others) have posted about using
SAS 9.4 was released a month ago, and we are excited about all the new features in SG Procedures, GTL and Designer. I wrote an article on SAS 9.4 graph features last month, and promised more to come. What then could be better than this Tech Talk video hosted by our
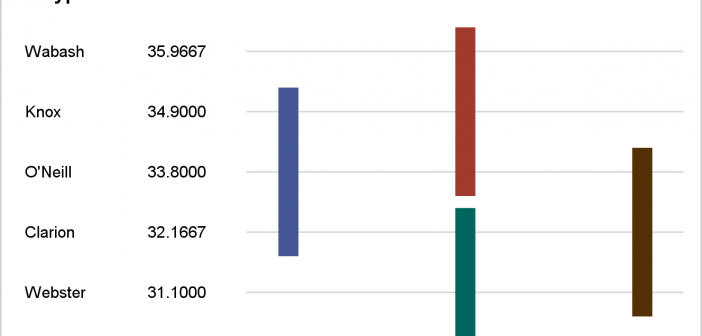
Last week, I presented some highlights of the new features for SG Procedures and GTL in SAS 9.4. Now, let us dig in a bit deeper. For a plot without a GROUP role, setting an attributes was always easy with SG procedures. All you need to do to set bar color
The 2013 SAS Global Forum is around the corner in San Francisco and the anticipation is building. Early indications are that attendee registration is up from last year, and we are looking forward to a great conference starting Sunday, April 28. It is great to see the large and diverse offering
ODS Graphics components like GTL and SG procedures are designed to work with Styles to create graphs that are effective in the delivery of information and aesthetically pleasing out of the box. You no longer have to tweak the colors to ensure a nice graph. The graph derives all the