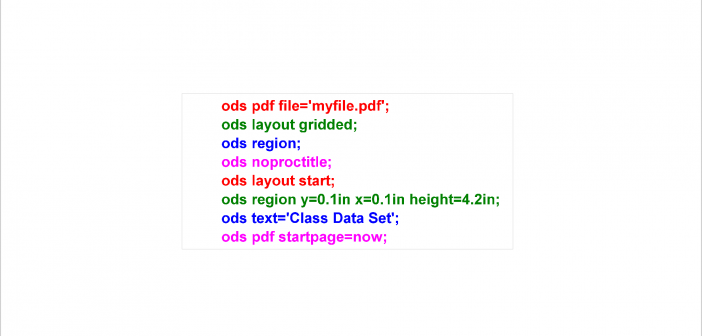
PROC SGPLOT displays titles inside the graph. If you want to display a title inside the graph and a different title outside the graph, you can use the ODS LAYOUT or the GTL. The ODS LAYOUT gives you precise control over your output and enables you to display multiple graphs and tables in each page.
Tag: GTL
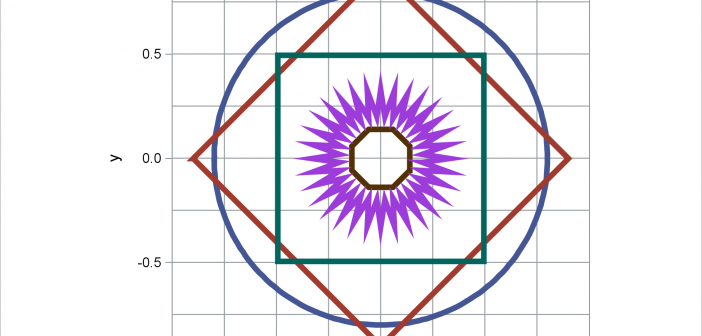
When displaying maps, geometric shapes (such as circles), or results of certain analyses, it is important to equate axes. This post illustrates options in PROC SGPLOT that enable you to equate axes.
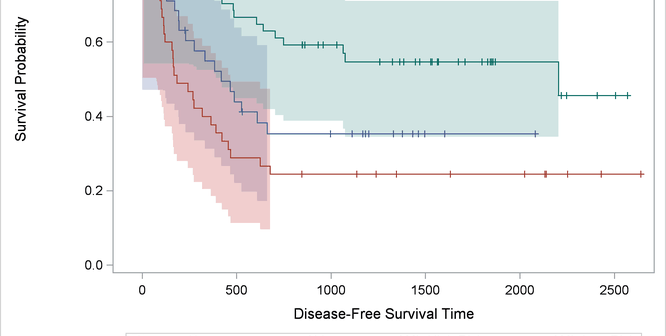
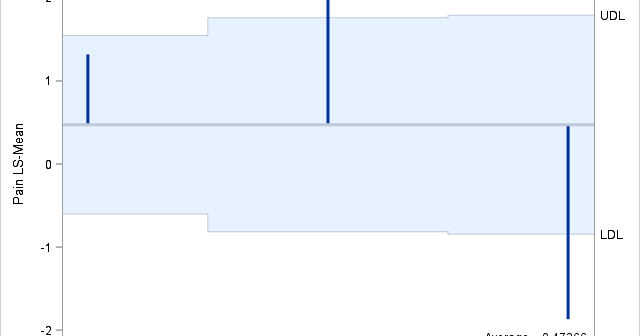
Customizing the Kaplan-Meier plot in assorted ways is so popular that we devote an entire chapter to it in the SAS/STAT documentation.
Did you know that you can make a graph extend across multiple pages? Making a multipage graph poses no problem for ODS Graphics---you simply use a BY variable to create page breaks. Most of the work involves deciding where to break pages and properly labeling continuations.
When the data object that underlies a graph is not quite in the form that you want, you might be able to use GTL expressions to produce precisely the graph that you want.
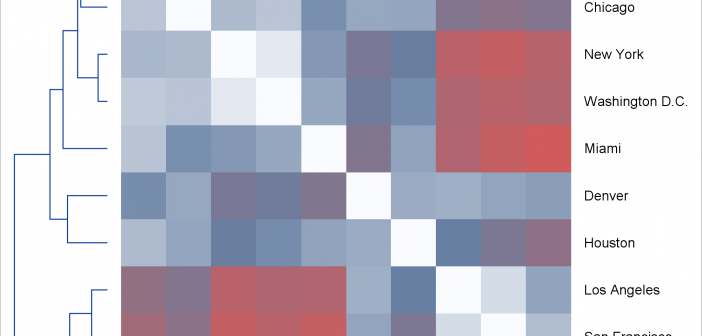
Today, I focus on the steps needed to make a graph that is composed of multiple heterogeneous components (in this case, dendrograms and a heat map).
SAS Global Forum 2017 is around the corner and SAS users are gearing up to travel to Orlando for a blockbuster conference. ODS Graphics is now a well known component of Base SAS and many readers of this blog who are proficient users of SG Procedures and GTL can look
PROC SGPLOT writes a graph template and uses it to create a graph. You can edit the template and then create a modified graph.
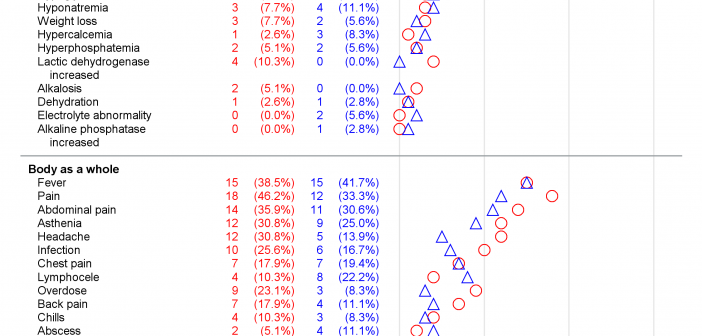
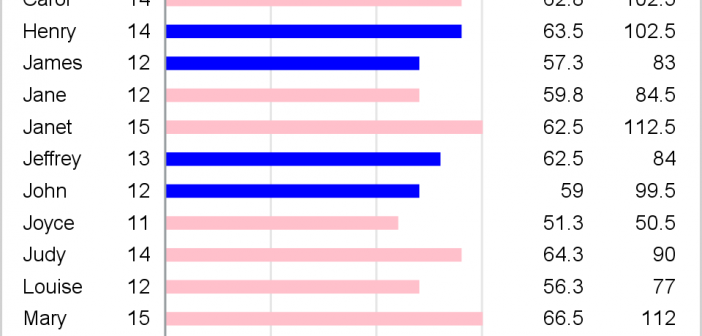
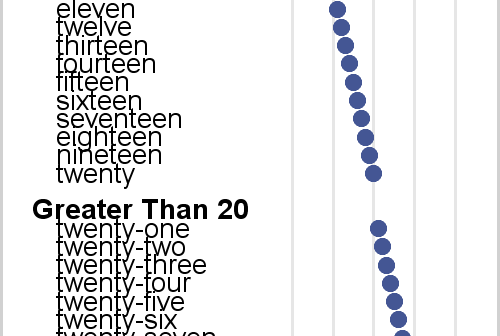
Axis tables enable you to combine tabular and graphical information into a single display. I love axis tables. My involvement with axis tables dates back over 30 years to their ancient predecessor, the table that contains an ASCII bar chart. In the mid 1980s, I created a table in PROC
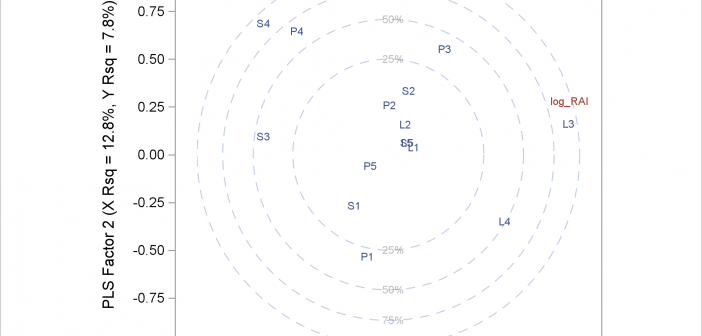
Have you ever wanted to modify a graph title that is produced by an analytical procedure? You can make a wide variety of changes by modifying the graph template. Modifying the graph template is straight forward. You specify ODS TRACE ON, run the procedure, find the template name, display the