English

Data Visualization
Sanjay Matange 4
Broken Y-Axis

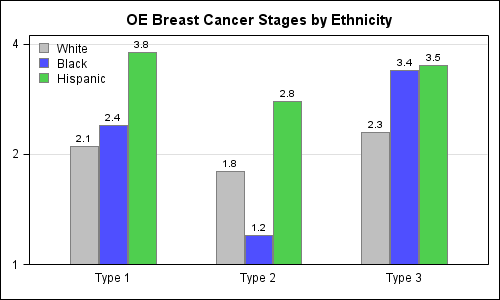
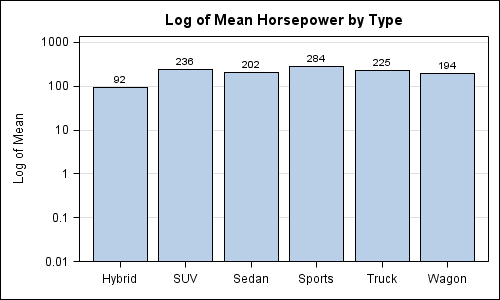
Often we want to display data as a bar chart where a few observations have large values compared to the rest.  Comparison between the smaller values becomes hard as the small bars are squeezed by the tall bars.  Here is an example data, and a bar chart showing the data. The large values

Data Visualization
Sanjay Matange 0
PharmaSUG 2012 update

PharmaSUG 2012 conference drew to a close today, concluding two and a half days packed with papers, presentations, posters, hands-on demos and super demos by SAS staff.  While the weather outside was a bit chilly from time to time, the conference what hopping with many user papers on how to

Data Visualization
Sanjay Matange 2
Axis values and hint

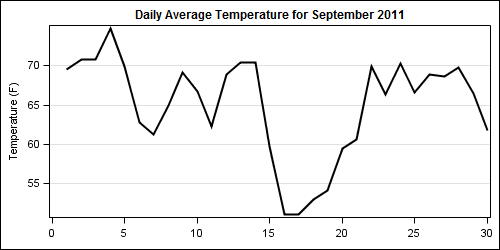
Getting the axis values just right generally requires some work, and the values you want can change from case to case.  One such example was discussed by Dan Heath in his post on custom axis values.  Here Dan shows the usage of non uniform axis values using the VALUES option on

1 45 46 47 48 49 52