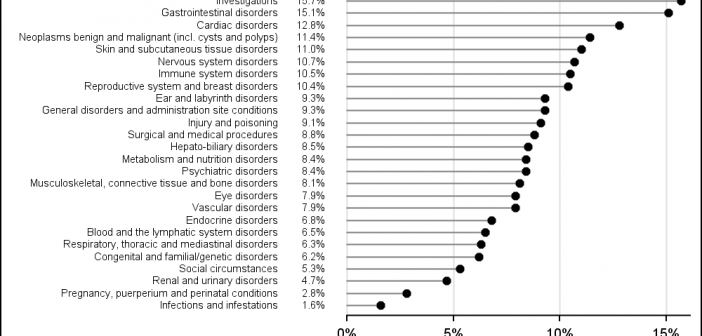
CTSPedia is a valuable resource for clinical research "... initiated to form an information resource created by researchers for researchers in clinical and translational science to share valuable knowledge amongst local researchers". This site includes a section on statistical graphs where you can find valuable information and a library of standardized
English
A few weeks ago I posted an article describing how to display simple Network Diagrams with Curved Links using SGPLOT procedure. The key requirement is that the node positions have to be computed by user. Often, for simple diagrams, nodes can be positioned using a simple layered layout. Separately, I also
For a long time, Starbucks represented to me as the good coffee cup, with me paying upwards of $4 for a Latte. But on a recent visit to San Francisco, my son introduced me to a few other options. Philz crafts a great cup of java, with the barista making
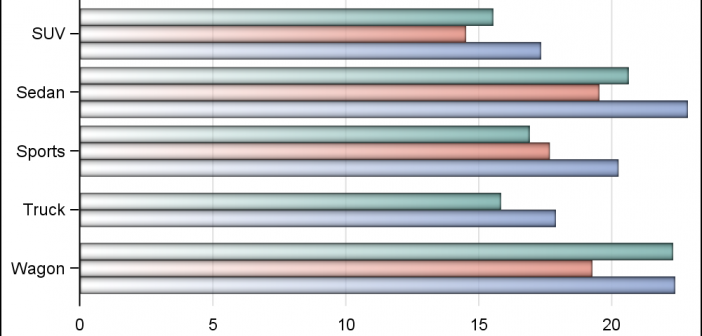
Recently a user was working with the HBAR statement with cluster groups with SG procedures. User wanted to see the group values on the axis. SGPLOT does not display multi level axes as these are shared with different plot types. However, with SGPLOT, there is often a way to get
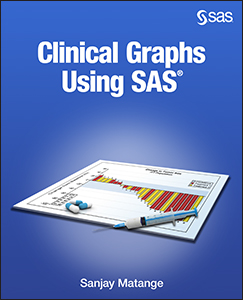
Most regular readers may have already noticed the release of my new book "Clinical Graphs using SAS", as indicated by the icon of the book cover and the link to the SAS Press page under the "About this blog" section on the right. This book is a result of the various
I have written a new book: Basic ODS Graphics Examples. It is available as a free PDF file on the web. It is in color, and all of the SAS code is available by double clicking a link at the beginning of each example. This new book complements my other
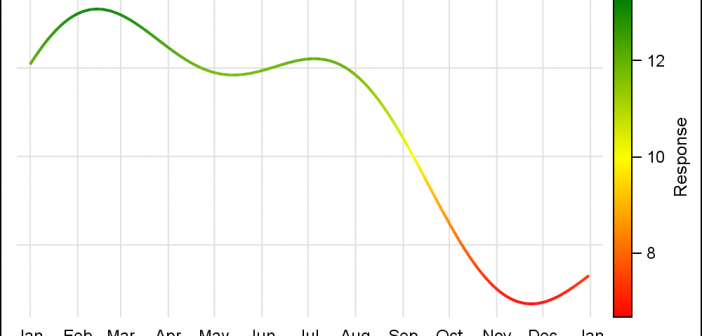
Returning from my recent visit to India, I was reading an article that included a graph with a series plot where the color of the series itself changed based on the Y response. Now, for sure, the SAS 9.40M3 SERIES plot in the SGPLOT procedure supports color response, but that applies
Let us continue with our journey beyond standard plots and charts. Often we need to create some simple diagrams to visualize the connections between different entities such as patients and providers or even a social network. Many of you may not have a custom tool to create diagrams. But you have Base SAS, so
Last week I posted an article on creating Infographics using SAS. The interest shown by the SAS community in this topic came as a surprise. Also, it so happened by coincidence, a SAS users also called into Tech Support just about the same time with a query about creating Infographics type graph
Last week a question was posted on the communities page about creating Box Plots where the width of each box is proportional to the frequency for the category. The comment was that PROC BOXPLOT can create such a graph, but there seems no way to do this using the SGPLOT