Search Results: sganno (46)

Data Visualization
Sanjay Matange 3
Graphs at WUSS - Part 1

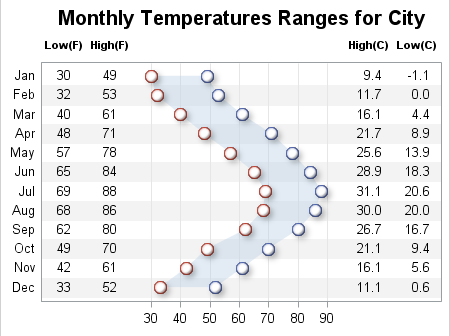
It is always a pleasure to attend SAS user conferences, regional conferences and in-house events.  In addition to presenting papers, seminars and super demos to the attendees myself, my favorite activity is to attend presentations by users that include graphical data visualization.  These include using SG procedures, GTL, Designer or SAS/GRAPH.  This year

Data Visualization
Sanjay Matange 1
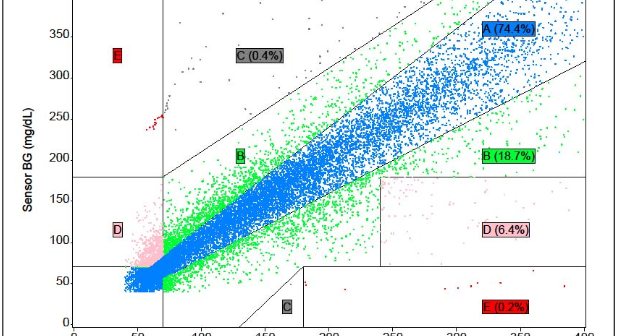
Clark Error Grid Graph

The SAS Global Forum conference last week was awesome.  From the perspective of graphics, there were more papers from uses on graphics and ODS graphics then in recent times.  I will post a summary shortly. One of the interesting papers was "#113-2013 - Creating Clark Error Grid using SAS/GRAPH and Annotate..."

Data Visualization
Sanjay Matange 0
In good company

A recent post on the SAS website shows the SAS Annual Revenue History.  It would be interesting to see how we could create such a graph using SG procedures, and how we could add more information and interest in the presentation.  So, I started with the basic informaiton on the annual revenues provided,

1 3 4 5