Welcome to this new blog on data visualization at SAS. Our goal is to engage with you on a discussion about analytical and business graphics for reporting and interactive applications. Our primary focus will be on ODS Graphics and related topics, but we look forward to a lively discussion on all things graphical.
What is ODS Graphics?
ODS Graphics is an extension of the Output Delivery System for creating and managing graphical output from SAS procedures. Bob Rodriguez, Sr. Director for Statistical R&D sums up the importance of integrated graphics as follows: "Effective graphs are indispensable for modern statistical analysis. They reveal patterns, differences, and uncertainty that are not readily apparent in tabular output. Graphs provoke questions that stimulate deeper investigation, and they add visual clarity and rich content to reports and presentations.". For more on this topic, see Bob's paper on Statistical Graphics.
With SAS 9.3, ODS Graphics is included with Base SAS and does not require a SAS/GRAPH license.
ODS Graphics means different things to different people, but it always means modern and easy analytical graphs in SAS. The system has different components, each suitable for a different audience, as follows:
- Create graphs automatically from SAS procedures. No additional knowledge of graph coding is required.
- Create graphs using Statistical Graphics (SG) Procedures.
- Create graphs using ODS Graphics Designer, an interactive application.
- Create graphs using the Graph Template Language (GTL).
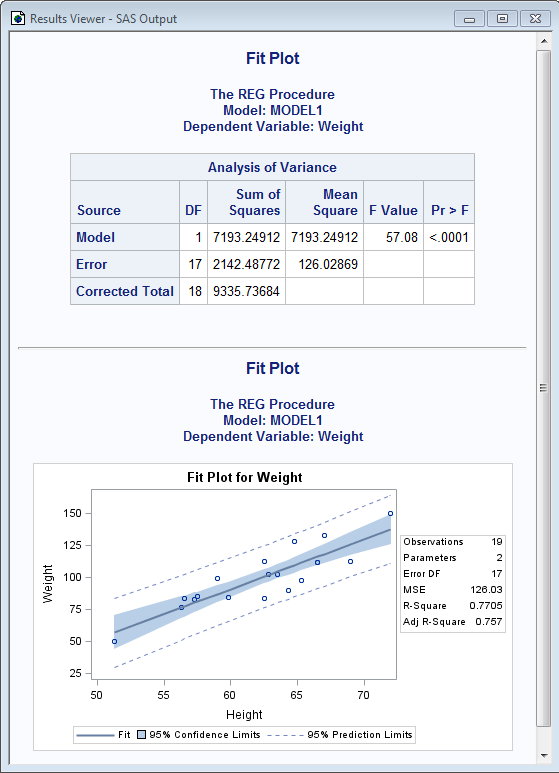
1. Automatic graphs (Audience: Statistician or Analyst):With SAS 9.2, graphs are created automatically by SAS procedures along with tables and written to the open ODS destination in the correct order. You can edit these graphs using the interactive ODS Graphics Editor. No additional knowledge of graph code is necessary, freeing the analyst to focus on the analysis task. Simply enabling the ODS Graphics system will produce these graphs along with the data tables as shown in the code and output below. With SAS 9.3, such automatic graphs are produced by default in DMS mode where ODS Graphics is on by default.
ods html; ods graphics on; ods select 'Analysis of Variance'; ods select 'Fit Plot'; title 'Fit Plot'; proc reg data=sashelp.class; model Weight = Height; quit; ods graphics off; ods html close; |
- The SGPLOT procedure for single cell graphs.
- The SGPANEL procedure for multi-cell class panels.
- The SGSCATTER procedure for comparative scatter plots and matrices.
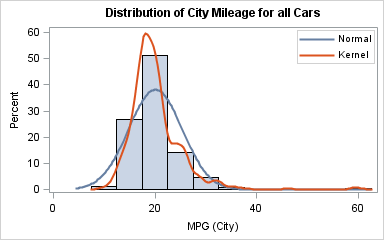
The code and output for a distribution plot using the SGPLOT procedure is shown below.
title 'Distribution of City Mileage for all Cars'; proc sgplot data=sashelp.cars; histogram mpg_city; density mpg_city; density mpg_city / type=kernel; keylegend / location=inside position=topright across=1; run; |
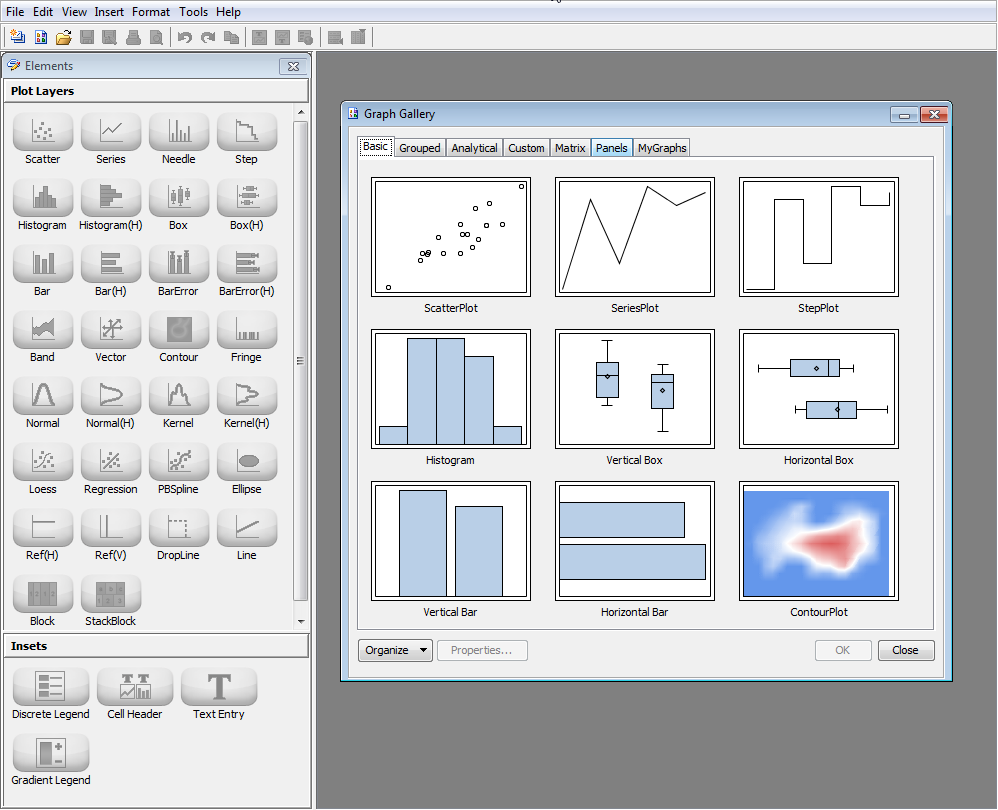
3. Create graphs using ODS Graphics Designer (Audience: Graph User): If you prefer to create custom graphs using an interactive application, Designer enables you to create the graph from your data using a drag and drop approach, with no knowledge of any graph code. You can view the GTL template code generated by Designer as you use the application. Graphs created in Designer can be saved and run in batch with same or different data. You can start Designer by submitting the code “sgdesign();” from the program window. In SAS 9.3, you can start Designer from the Tools menu.
4. Create graphs using the Graph Template Language (Audience: Advanced graph programmer). Complex, multi-cell graphs for clinical research and other applications can be created using GTL. The graph structure is defined in a template using the TEMPLATE procedure, and the graph is created using the SGRENDER procedure.
- Sanjay Matange (Editor)
- Dan Heath
- Prashant Hebbar
- Pratik Phadke


4 Comments
Great lineup Sanjay. Can't wait to see the wizardry from this group.
This blog looks great! I also ordered your book.
Pingback: mitraz
I have your book and, for what it is worth, I strongly endorse it!