Q: Company always try to forecast 12 or 24m ahead. Whether we should track accuracy of 1m/3m/ 6m or x month forecast, does that depend on lead time? How to determine out of these 12/24 months, which month should we track accuracy?
Correct, forecast performance is usually evaluated against the forecast that existed at lead time. Once inside the lead time, you presumably cannot do anything that materially impacts the outcome in the period being forecast. So it is kind of "cheating" to evaluate forecasting performance based on a forecast that can be changed within lead time.
Note: There may actually be good reasons to change a forecast within lead time, even though it is too late to impact any outcomes in the period being forecast. For example, suppose you have a four month lead time and forecast sales of 100,000 units in November. Factories begin production for the 100,000 units, and that cannot be stopped. However, a new competitor begins to steal your market share, or there is an economic crisis stifling overall demand, and suddenly it looks like you'll sell only 25,000 units in November. Should you change the November forecast?
Since we are within lead time, we cannot reduce the 100,000 units of production that are already on the way for November. However, by reducing November's forecast, we will now see an extra 75,000 units of inventory available, so we can reduce future production plans. In this kind of situation, it does make sense to change the forecast within lead time. But we still evaluate forecasting performance based on the original 100,000 unit forecast made at lead time.
Q: How would you define the naive forecast in cases where you are forecasting New Products? Where there is no historical data? Appropriate to use test market data to establish the naive forecast?
For new products, the random walk forecasts zero until you start having sales, at which time the forecast becomes the most recent observed actual. So a random walk is still a suitable naive forecast for new products. Remember, the naive forecast should require the minimum of cost and effort to create -- it is the ultimate baseline for comparison in FVA analysis.
Since there is cost and effort in utilizing test market data, I would not consider this a suitable basis for a naive forecast. However, the forecast based on test market data could be one of the methods you evaluate for its FVA, along with forecasts based on the judgment of management, and forecasts derived by any other methods.
Q: When you say walking [random walk]forecast for naive forecasting, is this the same as 3-month moving average or linear regression?
No, the random walk is not the same as a 3-month moving average or linear regression.
The random walk (aka "no change" forecast) is the traditional naive forecasting method, sometimes referred to as NF1. It says to use your most recent observed value as the forecast for future values. For example, if you sold 25 units last period, your forecast for future periods is 25. Every time you get a new "actual" you change your forecast to that latest actual.
Q: Can FVA be used to determine Life Time Buys for Phase-Out Products
No. FVA analysis is used to evaluate forecasting process performance -- are process steps and participants "adding value" by making the forecast better? It is not a method for generating forecasts or for procurement or inventory planning.
Q: We forecast at Platform or family level. Do you recommend doing FVA at the level we forecast at or at the item level since the naive forecast is at that level?
You are correct to always evaluate FVA at the most granular level of detail that you forecast -- typically item or item/location. But if Platform or family is the most granular level at which you generate forecasts, then you would generate the naive forecast at that level. (Thus, the random walk forecast at family level would be the most recent "actual" at the family level.)
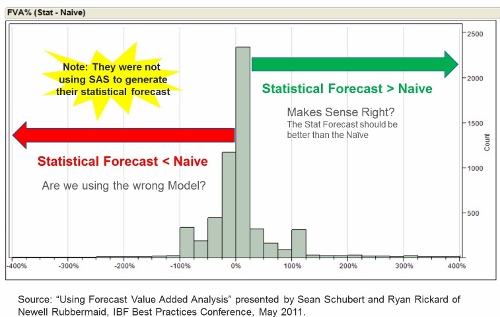
Most organizations have forecasts at a more granular level than family (e.g. item, item/location, or item/customer). In this situation, you can report on the "average FVA" at an aggregate level, like product family or platform. But averages often hide relevant information, and so creating a distribution of FVA values at the aggregate level is important. We saw an example of this in the FVA histograms from Newell Rubbermaid presented by Sean Schubert and Ryan Rickard:

