The universe of customer experiences, digital analytics, personalization and decisioning is massive. At times, it can seem as complicated and vast as the galaxy itself. With intricate subjects underneath this umbrella, you can lose direction, wander aimlessly, or feel a misleading sense of success or failure. When you lose vision, your appetite for predictive clarity increases.
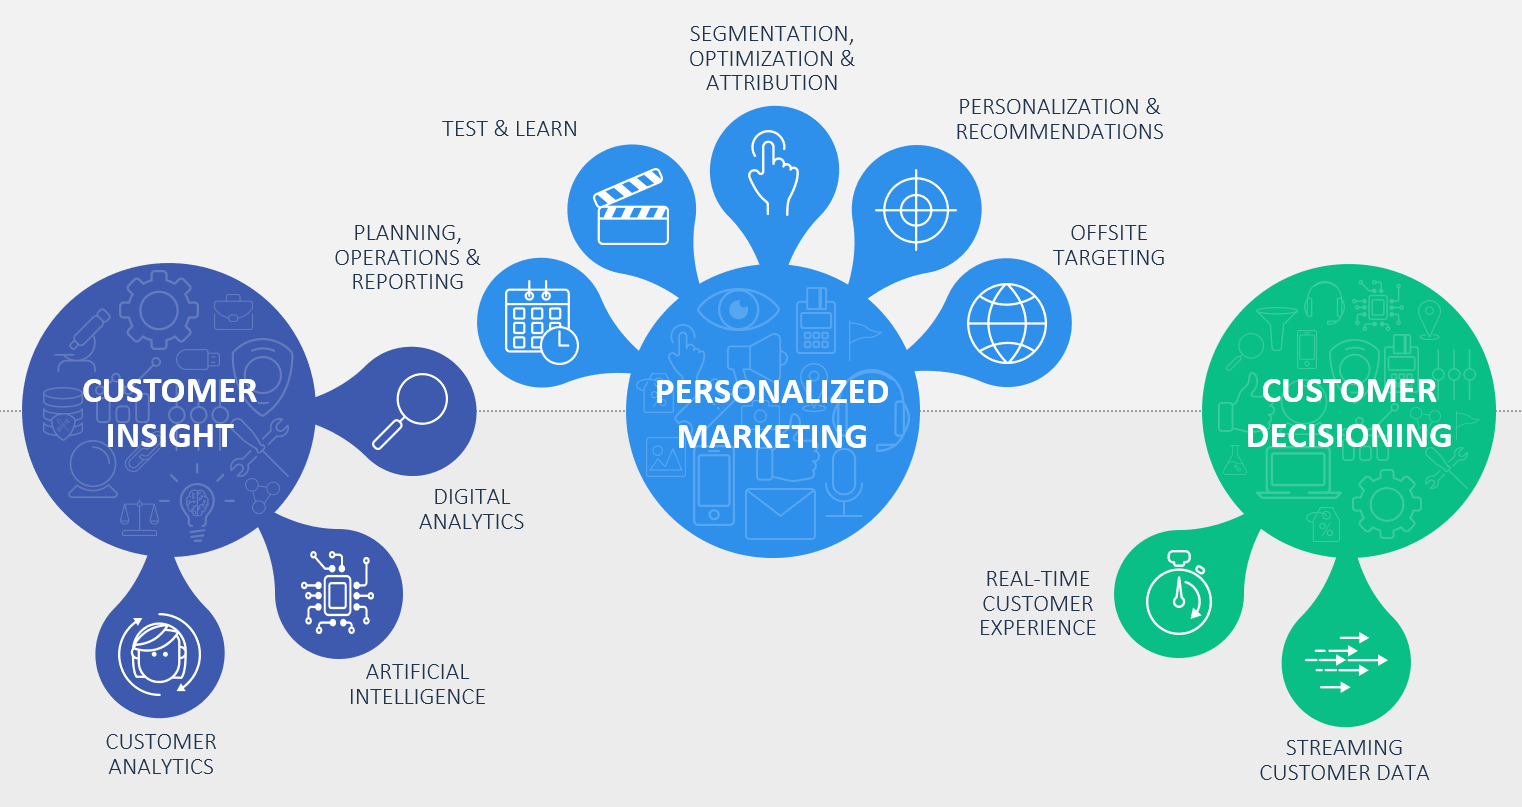
From tactical to strategic, there are categories of analysis that range from foundational to advanced for every brand. Consider the unique altitudes of dependency for various metrics and key performance indicators by organizational role:
Analysts and managers:
- Click-through rate
- Cost-per-acquisition
- Checkout abandon rate
- Journey path length
Directors:
- Gross profit
- Conversion rate
- Likelihood to recommend
- Micro outcomes
Vice presidents and c-suite executives:
- Lifetime value
- Incremental profit per channel
- Per visit goal value
- Profit per customer
Altitude defines the scope and significance of decisions. It also influences the frequency at which data is received, and the associated depth of insights. For example, managers are typically required to make tactical decisions – impacting say tens of thousands of dollars. At the other end of the spectrum, vice presidents shoulder the responsibility for making wide sweeping strategic decisions – impacting tens of millions of dollars.
When offered delicious data, everyone wants more.
In my encounters with marketing professionals across industries, I frequently hear that more data can lead to better results. Just take a look at the martech space in the last five years. The rise of DMPs and CDPs have been hard to ignore, but somehow topics like predictive analytics and decision management are optional.
Wow! Insert confused emoji image here please.
If more data simply equaled smarter decisions, there would be peace on earth. According to SAS COO and CTO Oliver Schabenberger:
“Data without analytics is value not yet realized.”
We can do so much better. A core part of our job, as individual contributors or leaders within the analytics practice, is to ensure that prescriptive insights reaches the right individual at the appropriate time. Machine learning and artificial intelligence represent all the rage right now. For the metrics listed above, there could be a model to help for each one. I recently wrote about how users of SAS Customer Intelligence 360 can efficiently perform end-to-end machine learning projects. For readers seeking a primer, please check it out.
What happens when a brand develops an inventory of models ready for action?
Today’s machine learning techniques allow analysts to quickly train and create more models faster than ever. As efficiency increases, authoring models is only one aspect of the analytical lifecycle that brands need to consider. As the number of models increases to support more business objectives, so does the requirement to manage these assets as valuable competitive differentiators.
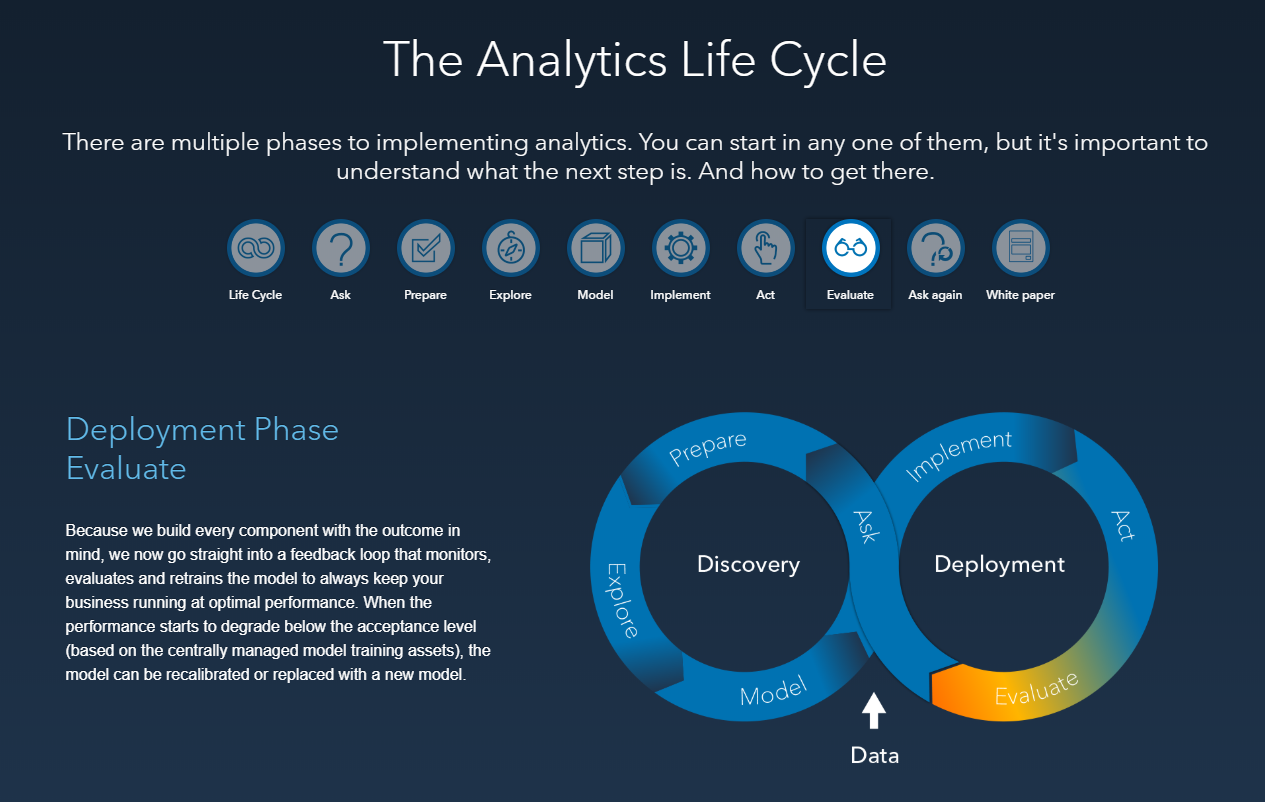
Model management is not a one-time activity, but an essential business process. Models must be well developed and validated to demonstrate that they are working as expected. Outcome analysis is also necessary to:
- Ensure that the scores derived from applying the model to new data are accurate.
- Verify that model performance over time remains satisfactory.
Other aspects include cataloging and tracking this growing inventory of analytical assets, while providing support for the governance of these models using version control through repeatable and traceable workflows.
Here’s an example using multiple models constructed to address propensity targeting on sas.com. Leveraging structured views of web visitor data captured by SAS Customer Intelligence 360, users can leverage model studio within SAS Visual Data Mining and Machine Learning to construct machine learning pipelines.
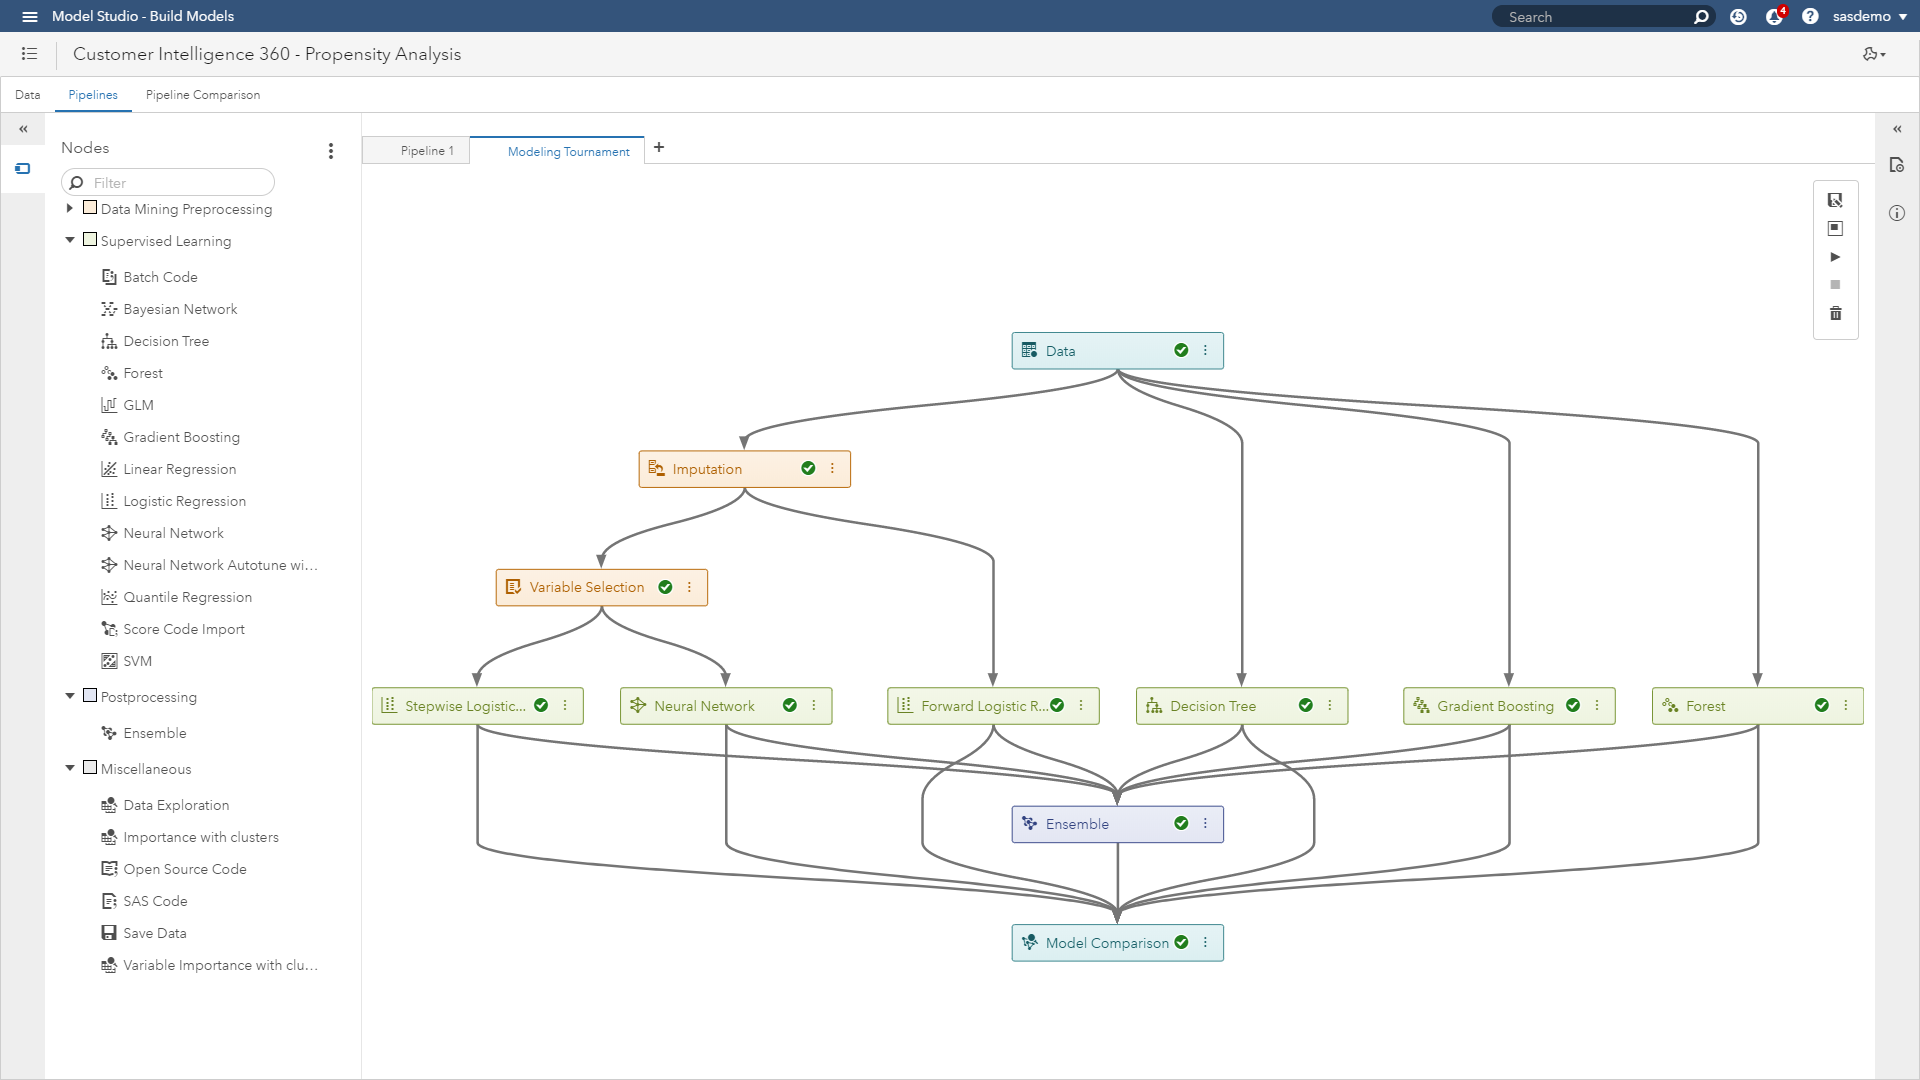
In the figure above, the pipeline project is using seven different algorithmic approaches to identify the approach that will maximize scoring precision and minimize error:
- Stepwise logistic regression
- Neural network
- Forward step logistic regression
- Decision tree
- Gradient boosting
- Forest
- Ensemble
In other words, predictive accuracy. For those of you interested in technical documentation of these modeling procedures, please go here.
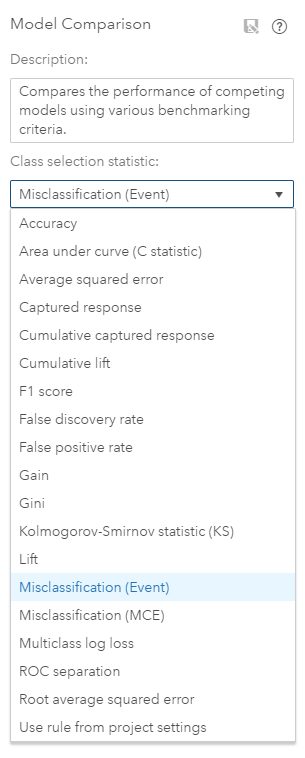
Figure 4 highlights the menu of options available for selection criteria of the champion model. In this example, you would select the misclassification event rate because you want to maximize the accuracy to predict who is likely to convert to help your marketing team achieve higher returns.
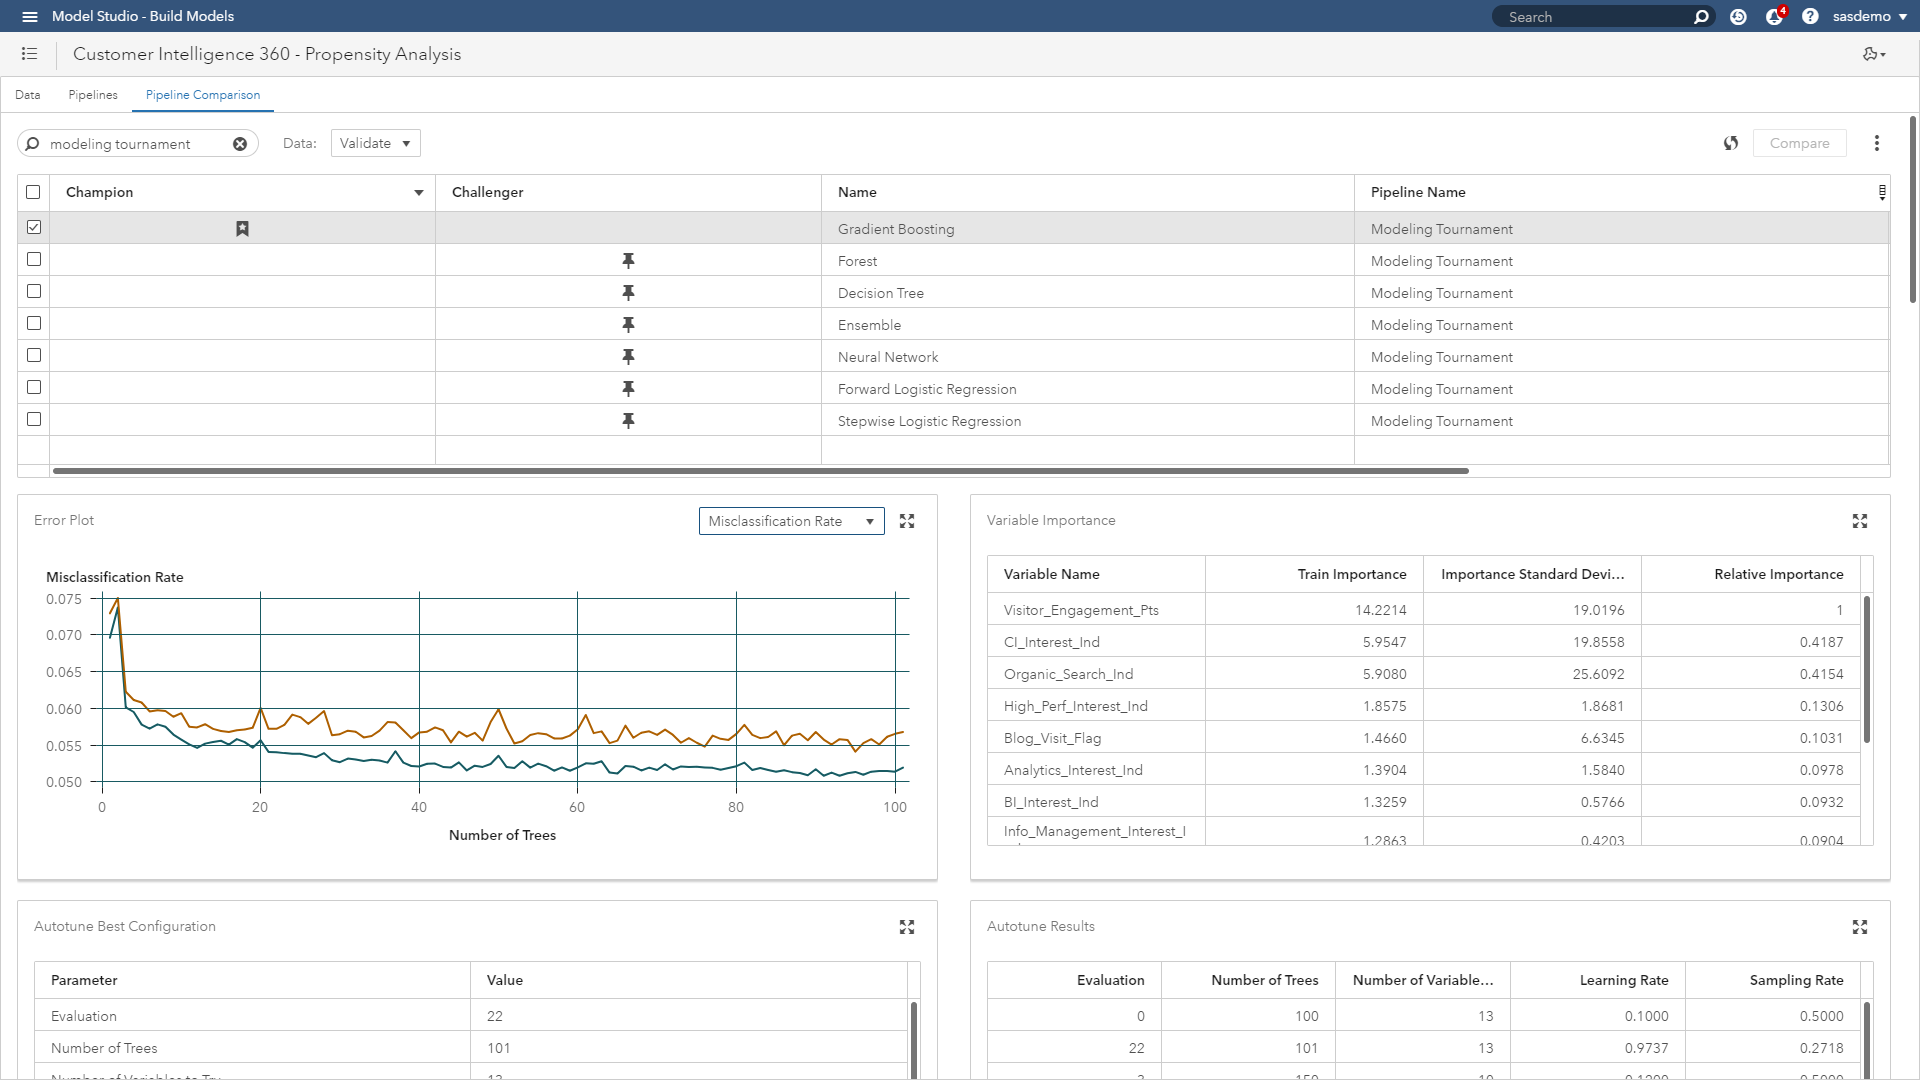
This results in an auto-tuned gradient boosting model outperforming all other challengers. The pipeline comparison dashboard shown below provides a deep set of model interpretability visualizations, diagnostics and scoring logic.
Takeaways
SAS’s vision is to help digital marketers be effective through analytic techniques. This article summarized how quickly analysts can work with machine learning projects. With this new reality in-flight, the requirement to manage these assets effectively is critical for data-driven brands.
In part two of this blog post series, we will:
- Demonstrate how brands manage actionable analytical assets.
- Provide a practitioner-oriented use case example.
