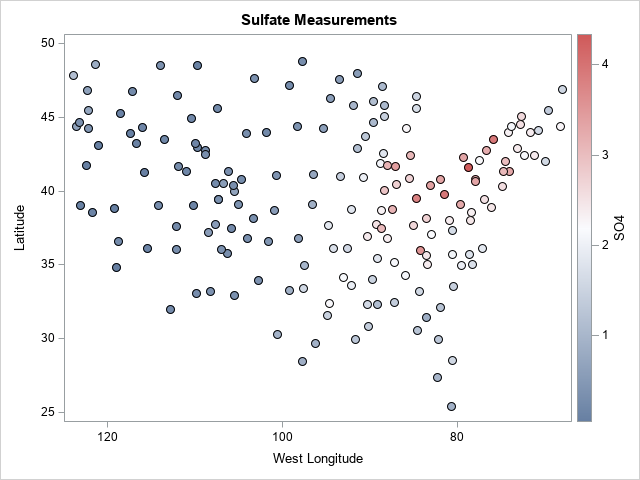
Control the fill and outline colors of scatter plot markers in SAS

This article shows how to use PROC SGPLOT in SAS to create the scatter plot shown to the right. The scatter plot has the following features: The colors of markers are determined by the value of a third variable. The outline of each marker is the same color (such as