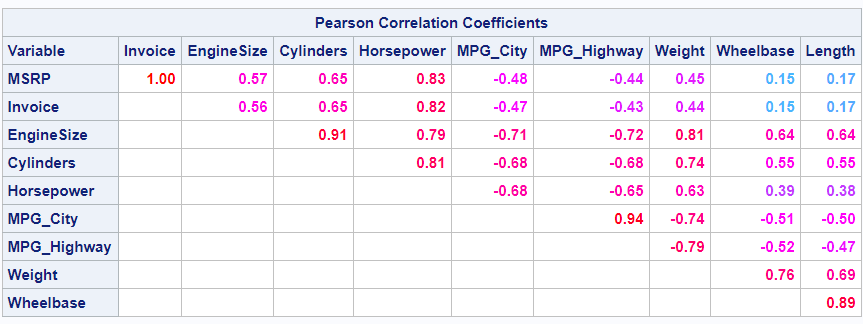
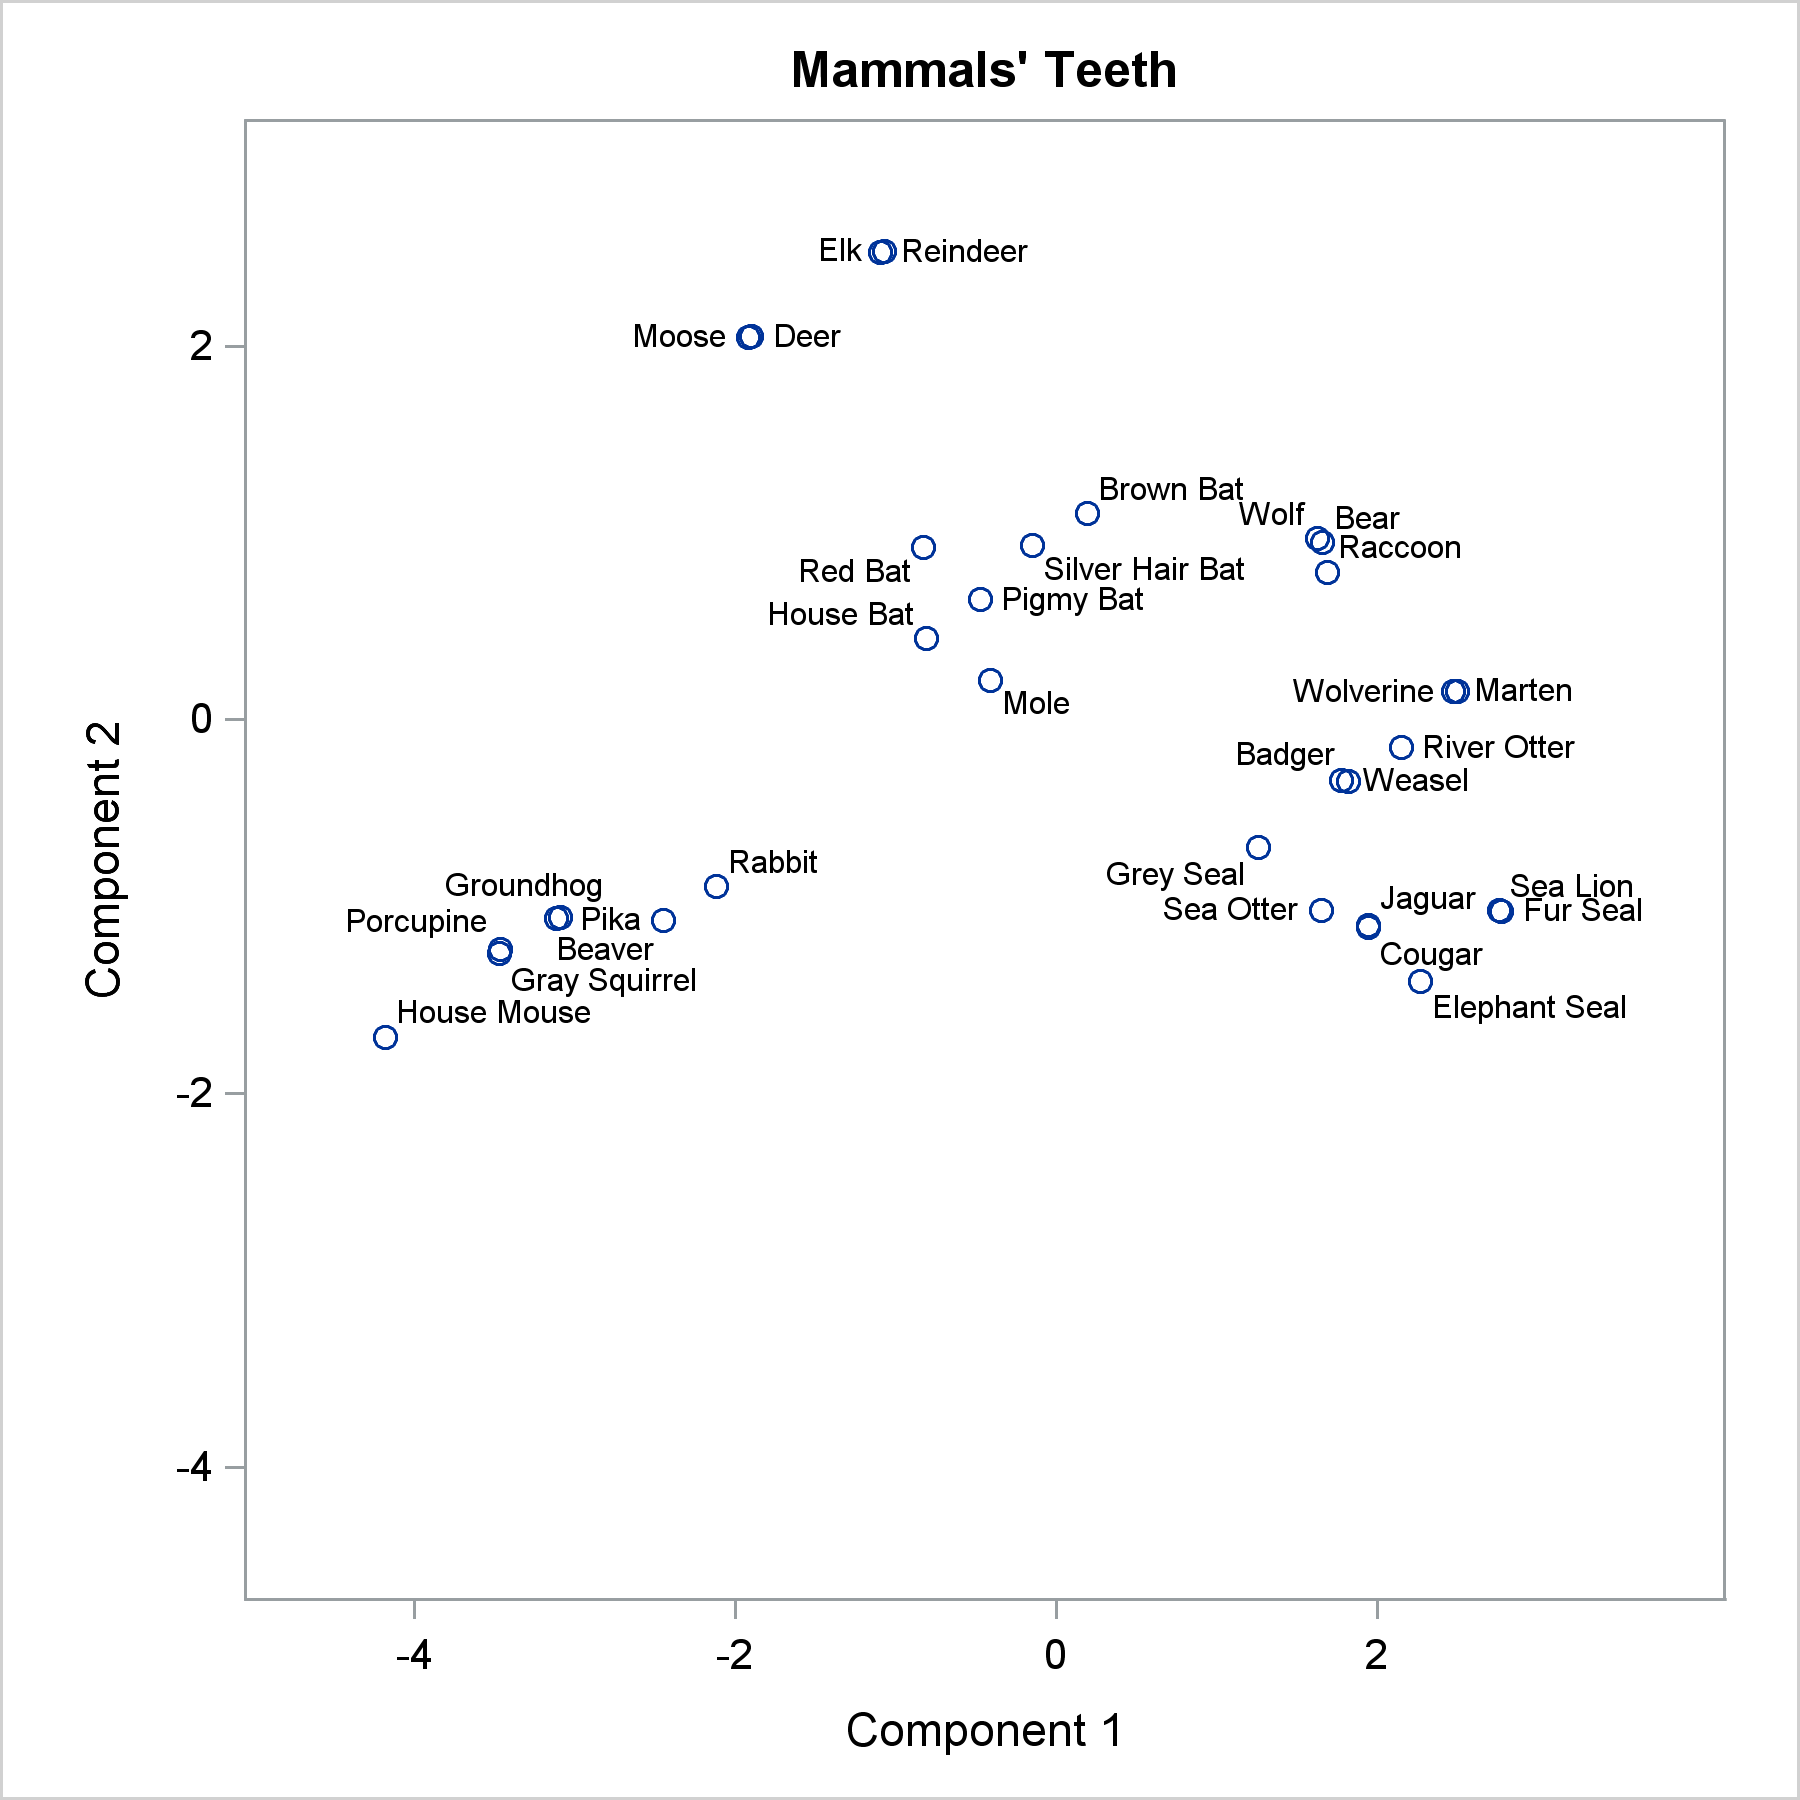
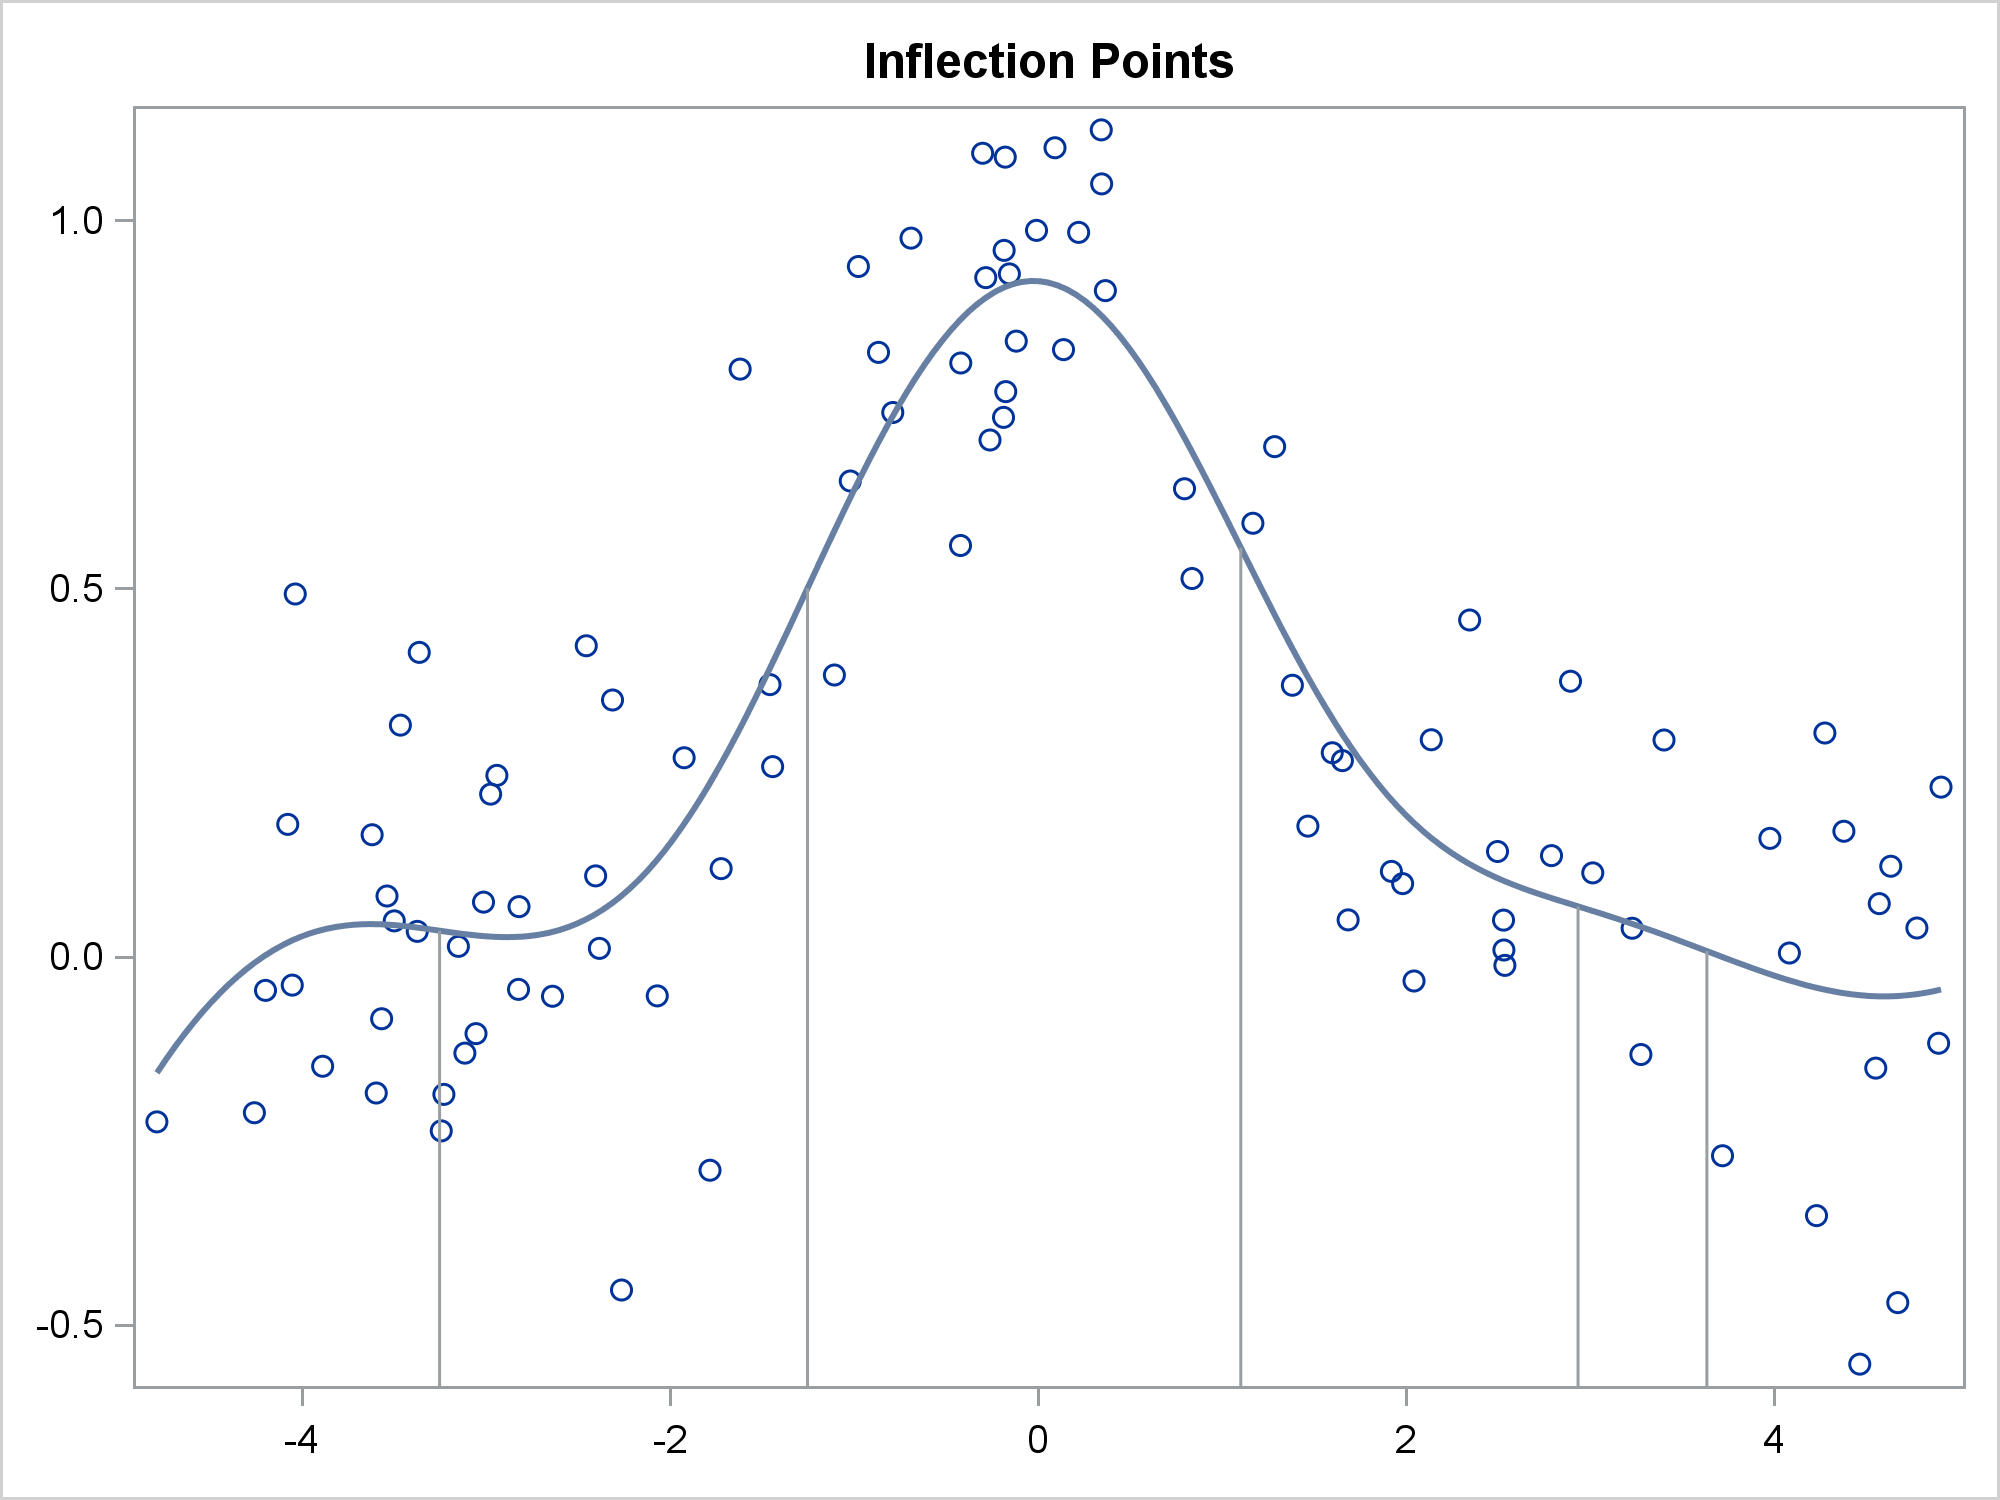
This post shows you how to run PROC SGPLOT, create smooth curves by using penalized B-splines, use ODS OUTPUT to create an output data set from PROC SGPLOT, and process it to display drop lines.
This post shows ways to display the upper or lower triangle of a correlation matrix. You can also use colors to show the magnitude of the correlations.
The POSITION= option in the TEXT statement provides you with a way to position text in a variety of locations relative to a point. You can use this option to fine tune label placement in a plot primarily created by using the SCATTER statement and the DATALABEL= option.