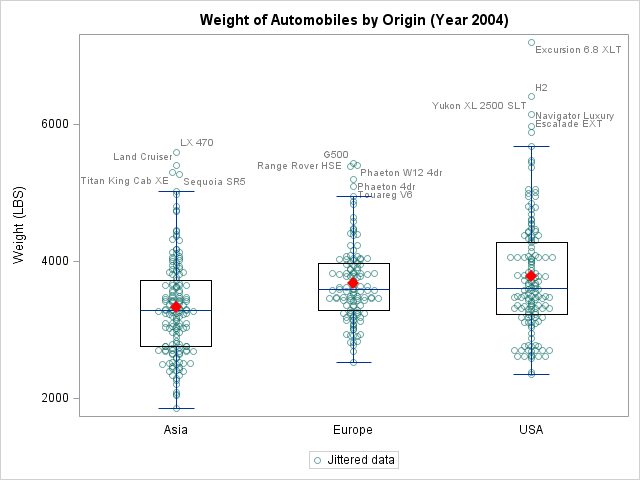
There was a recent comment on the original 'Unbox Your Box Plots', where a user wants to see the original data for the box, but only label the outliers. As noted in the comment, labeling all the scatter markers and turning on the outlier display is not ideal. But there
Author
Following Sanjay's cue (see “R U Graphing with SAS”), I tried creating data driven multi-cell graphs using R. I played with the lattice and ggplot2 packages. I found ggplot2 simpler to understand and use than lattice, but there are probably some trades offs. Data-driven layouts are referred to as 'faceting'
Are you in the market for a new car? Perhaps you are researching how the various parameters of cars match up to each other? Well, in SAS 9.4 Maintenance 1 release, ODS Graphics will support a new versatile plot: the polygon plot. As the name suggests, it lets you draw
“So, you work for SAS?” asked my co-passenger. I was on the plane to Baltimore to attend my first NESUG conference and the tag on my laptop bag was the clue. I happened to be seated next to a SAS user who was familiar with ODS Graphics. I ended up
At the 2012 SAS Global Forum, one of the questions from a user was about showing the original data used for the box plot. While you can use outliers in conjunction with the box features to get a feel for the data, for some situations you may need to see exactly
Most users of the ODS Graphics system have probably had the need to adjust the dimensions of their graph output at times. The ODS GRAPHICS statement makes this easy to do. This statement supports the WIDTH= and HEIGHT= options. If you set just one of these, the system will calculate
The dimensions of your graph can affect the aspect ratio, which in turn, can subtly affect the perception of your viewers. When visual perception is of prime importance, the aspect ratio of the graph needs to be adjusted with care. This technique is known as ‘banking’, was introduced by William