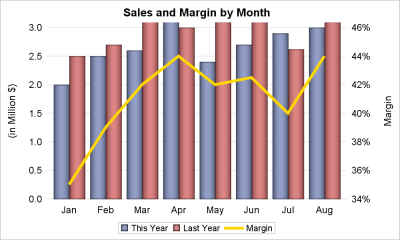
A dual response axis chart is useful when the data type for the multiple measures are not compatible. For example, when overlaying measures like "This Year" sales with "Last Year" sales, the format and magnitudes of the two measures (or values for two groups) may be compatible, and it is
Tag: VBAR
This is the 2nd installment of the "Getting Started" series, and the audience is the user who is new to the SG Procedures. It is quite possible that an experienced users may also find some useful nuggets here. One of the most popular and useful graph types is the Bar
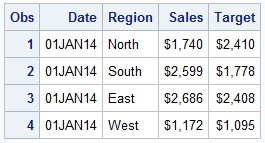
An interesting question came up recently, where a colleague wanted to create a bar line chart with Revenue on the Y axis and Profit on the Y2 axis. The Revenues were all positive, but the Profit had positive and negative values. Some data I generated is shown on the right. Creating this
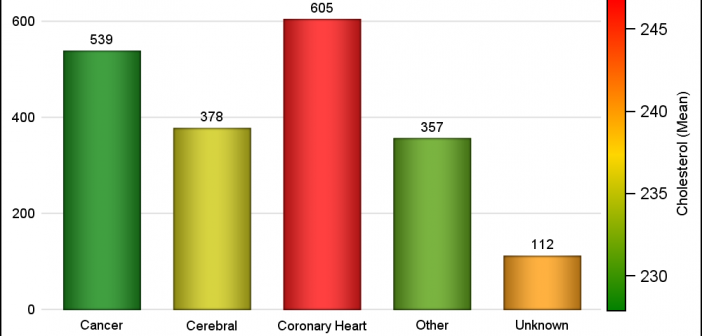
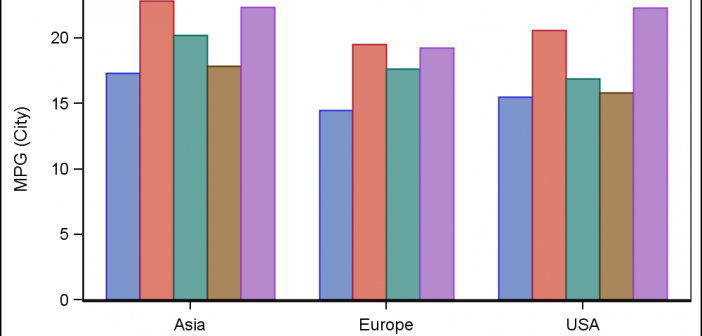
Often there is a need to display more than one response simultaneously for a bar chart, series plot or a vector plot. SAS 9.40M3 adds the options you need to get such results using two new options COLORRESPONSE and THICKRESPONSE where applicable. The Bar Chart on the right shows the frequency
When we first released GTL and SG Procedures back with SAS 9.2, Box Plots and Bar Charts would always treat the category axis as discrete. We realized soon enough that we need to support box plots on scaled interval axes for many clinical applications, and this was added in SAS
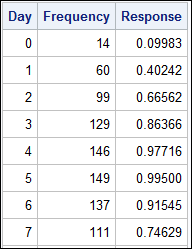
A common scenario is where we have a table of multiple measures over time. Here we have a simple example of Frequency and Response by Day. The Response is a linear function of the Frequency, as shown in the table on the left below. The shape of the data is
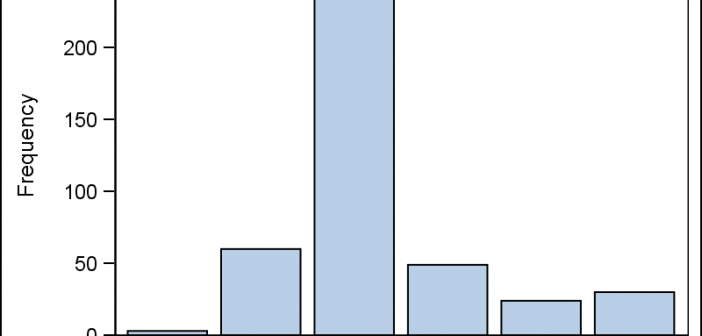
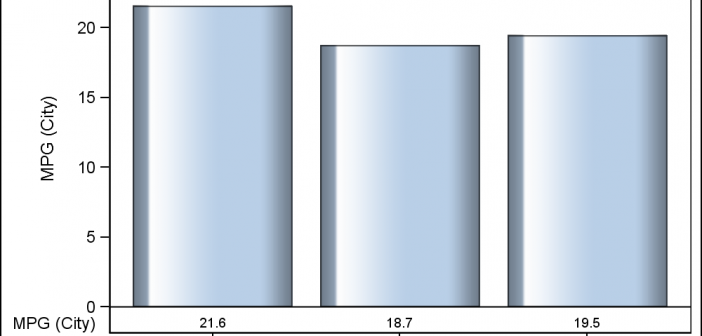
As Sheldon Cooper would say, this is the first episode of "Fun with Charts". I did not find a cool term like "Vexillology" and "Cartography" is taken by map making, so let us go with "Chartology". Yesterday, I saw a couple of interesting bar charts as shown on the right. I thought
This article is by guest contributor Lelia McConnell, SAS Tech Support. Several users have called recently to ask the question, “Can I reorder the legend entries on the bar chart that I created with PROC SPLOT?” Although there is no option that does this directly in PROC SGPLOT, the answer
The GCHART procedure has a popular option called G100 to display all the subgroups in % format such that all the subgroup values add up to 100% for each group. Each subgroup is labeled with its own % values. SGPLOT procedure does not such an option, but with a little bit of
Creating a Bar Chart with a table of statistical data aligned with the bars is a popular topic. With SAS 9.4, creating such graphs gets easier with the new AXISTABLE statement in GTL and SG procedures. But some use cases can flummox the latest gizmos. Such is the case I ran into recently. Here