Search Results: panel (76)

Data Visualization
Sanjay Matange 3
Sochi Medal Graphs

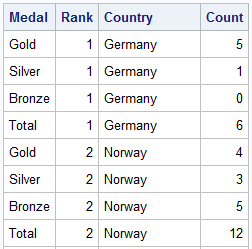
The attention of the world is now on Sochi and the Winter Games.  Gold, Silver and Bronze medals are being earned by these amazing athletes, and everyone has an eye on the tally.  Andre sent me a link to TRinker's R Blog, showing a graph of the current tally.  Andre

Data Visualization
Sanjay Matange 0
Graphs at WUSS - Part 2

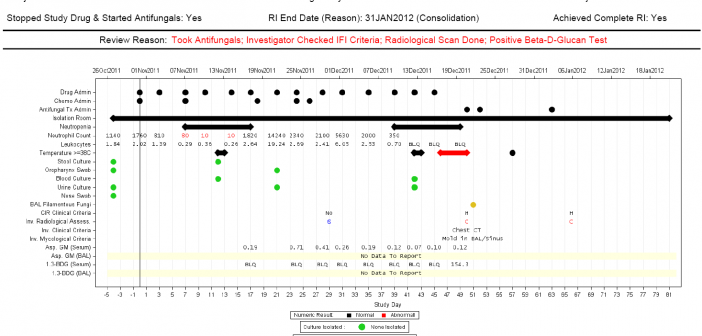
Last week I covered some of the interesting graph-related papers presented at WUSS.  There were quite a few, so I broke up the report into two parts.  Here is the second installment. In the paper  Creating Graphical Patient Profiles using SAS by William Garner of Gilead Sciences, the author describes how to create

Data Visualization
Sanjay Matange 3
Graphs at WUSS - Part 1

It is always a pleasure to attend SAS user conferences, regional conferences and in-house events.  In addition to presenting papers, seminars and super demos to the attendees myself, my favorite activity is to attend presentations by users that include graphical data visualization.  These include using SG procedures, GTL, Designer or SAS/GRAPH.  This year

Data Visualization
Sanjay Matange 2
Graphics with SAS Web Editor

Recently, SAS released SAS Solutions OnDemand for academics.  An academic user who is signed up for this can use the SAS Web Editor application to do all their data analysis over the web using a hosted server at SAS.  This frees up the user from having to install the software on their own computers,

Data Visualization
Sanjay Matange 4
GTL Layouts

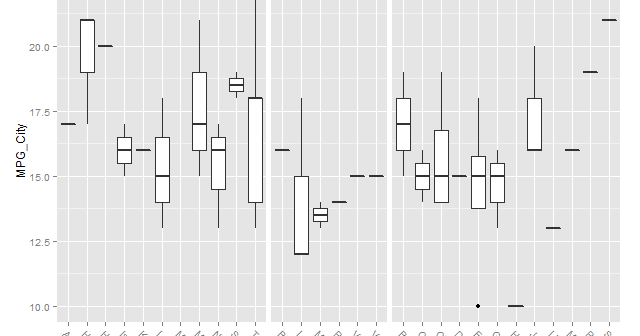
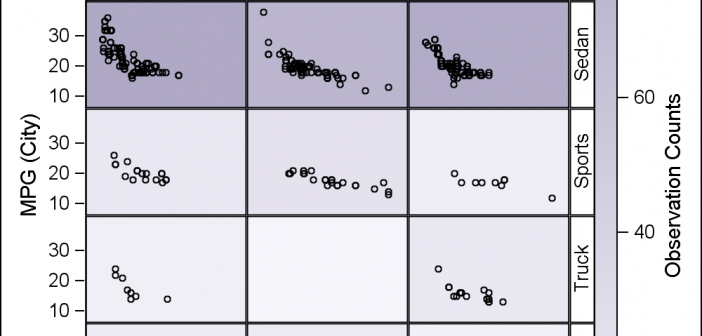
The Graph Template Language (GTL) provides you the ability to create complex graphical layouts. We have seen how to create a regular grid of cells based on one or more classification variables using the SGPANEL procedure.   Each cell contains the same type of plot.  This topic was covered in Dan's article on

Data Visualization
Sanjay Matange 3
Percent VBar

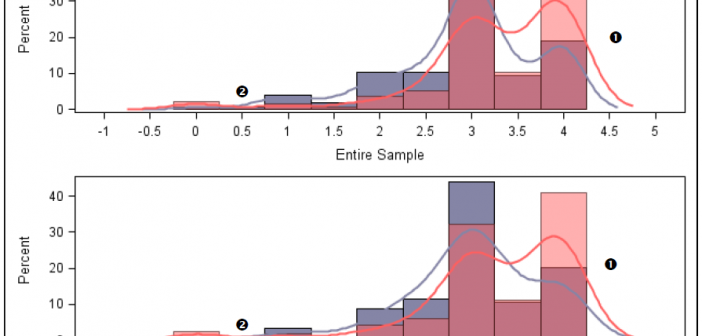
Recently a reader chimed in with a question on the Do Loop article by Rick Wicklin on how to create a bar chart with percent statistics.  Rick used SAS 9.3  and the reader wanted to do the same with SAS 9.2. For the basic (non-grouped) bar chart, the process is the

1 4 5 6 7 8