Search Results: boxplot (18)

Data Visualization
Sanjay Matange 1
The HIGHLOW Plot

SG Procedures and GTL provide you with a large set of plot statements, such as BarChart, ScatterPlot, BoxPlot and more.  You can use them for the intended purpose, and all is well and good.  However, the real fun starts when you leverage a plot to do something that was not

Data Visualization
Sanjay Matange 2
Schematic Plot

Recently a user chimed in on the SAS Communities page, requesting a way to add some observation level annotation to a box plot.  Wendy was delighted to see a graph created by the UNIVARIATE procedure called "Schematic Plot".  In this graph, the box plot of the analysis variable is shown with

Data Visualization
Sanjay Matange 4
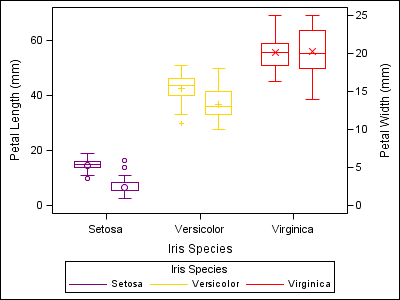
Box with Scatter Overlay

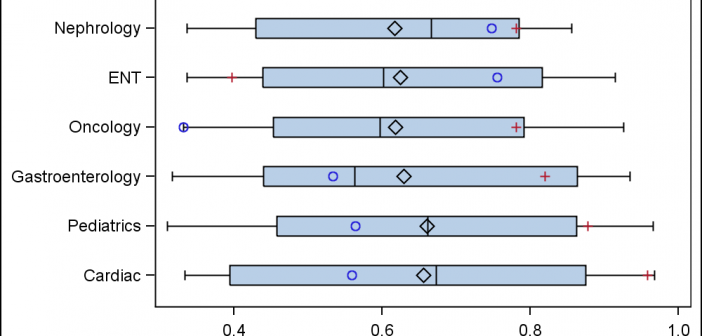
A common request we have been often hearing is for display of the distribution of data as a box plot, along with some detailed information overlaid.  For example, one may have ratings data of all the hospitals in a region by different specialty, and you want to view this distribution

Data Visualization
Sanjay Matange 0
Density Strip Plot

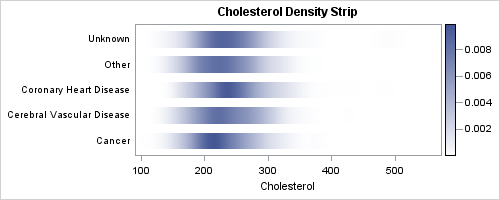
In the previous post on Violin Plots, we discussed the process to create custom density plots.  This work was done in collaboration with SAS user James Marcus.  This is the second installment on the same topic - Creating Density Strip Plots.  We will use the same data and process to compute