Strengthen your programming skills with tips and techniques from the experts

One-pass formulas for mean and variance

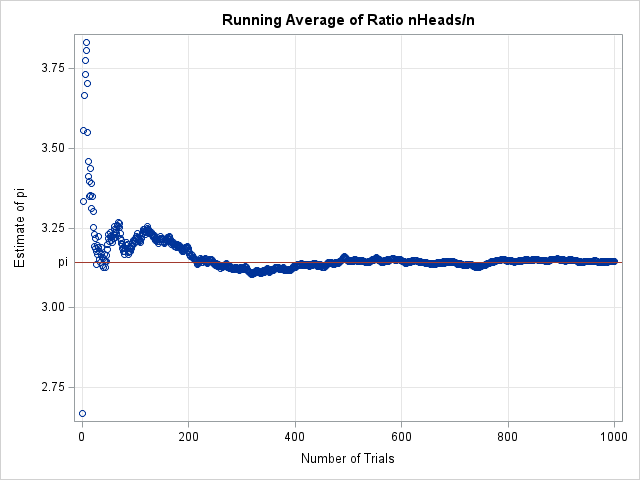
In statistical programming, we often assume that the data are stored in a matrix or a data set and can be read at will. For example, if you want to compute a sample mean or standard deviation, you simply pass a vector to a built-in function, and the software spits