Learn about the latest tips, tutorials, upcoming events and certifications
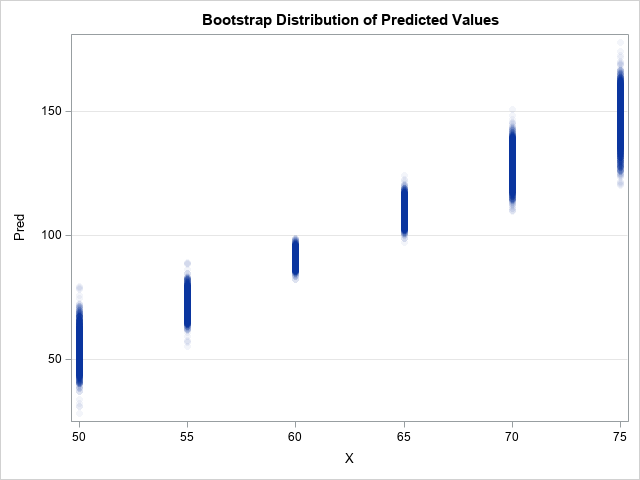
Bootstrap predicted means by using PROC GLMSELECT

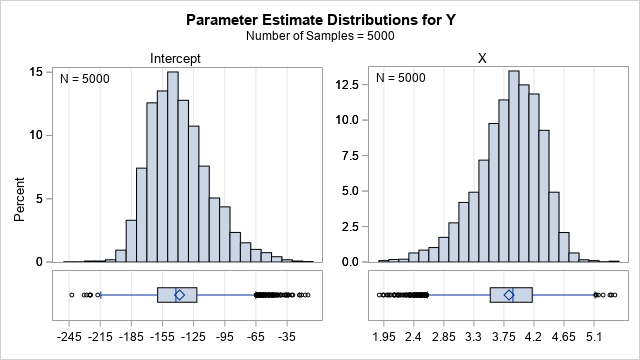
A previous article shows how to use the MODELAVERAGE statement in PROC GLMSELECT in SAS to perform a basic bootstrap analysis of the regression coefficients and fit statistics. A colleague asked whether PROC GLMSELECT can construct bootstrap confidence intervals for the predicted mean in a regression model, as described in