Get the right information, with visual impact, to the people who need it
Creating Spaghetti Plots Just Got Easy

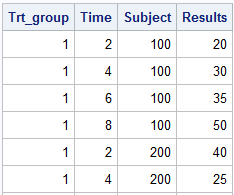
This article is by guest contributor Lelia McConnell, SAS Tech Support. Creating Spaghetti Plots Just Got Easy Sample 38076: “Response by patient and treatment group” illustrates how to generate a spaghetti plot using the SGPLOT procedure. Sample 40255: “Plot of study results by treatment group” illustrates how to generate a