Data Visualization

Get the right information, with visual impact, to the people who need it
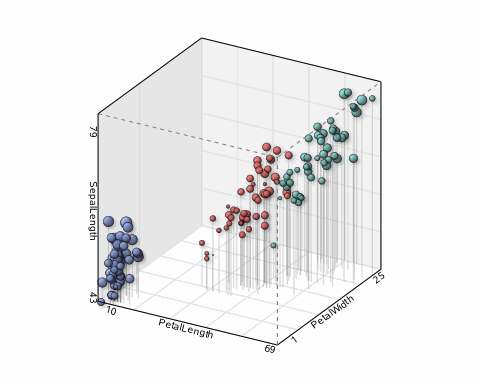
Data Visualization
Sanjay Matange 0
Scalable Turnip Graph

A Turnip Graph displays the distribution of an analysis variable.  The graph displays markers with the same (or close) y coordinate by displaying the markers spread out over the x-axis range in a symmetric pattern.  Recently, a question was posted on the SAS Communities page regarding such a graph. Here is an example of

Data Visualization
Sanjay Matange 0
Dial KPI using SGPLOT

Last week I was at PharmaSUG 2016, where I presented a 1/2 day seminar on creating Clinical Graphs using SAS.  I was gratified to have a enthusiastic audience of about 28 attendees and we had a great interactive session.  I also presented a paper on Clinical Graphs Using SAS.  More

Analytics | Data Visualization
SAS Poland 0
Standardy wizualizacji danych

INTERNATIONAL BUSINESS COMMUNICATION STANDARDS to organizacja określająca międzynarodowe standardy komunikacji biznesowej i przedstawiająca propozycje dotyczące projektowania zrozumiałych raportów biznesowych i prezentacji. Niniejszym wpisem rozpoczynamy serię artykułów dotyczących tych rekomendacji – osadzając je w kontekście narzędzia do wizualnej eksploracji danych – SAS Visual Analytics.

Data Visualization
Sanjay Matange 0
Directed Link Networks

A few weeks ago I posted an article describing how to display simple Network Diagrams with Curved Links using SGPLOT procedure.  The key requirement is that the node positions have to be computed by user.  Often, for simple diagrams, nodes can be positioned using a simple layered layout.  Separately, I also

1 34 35 36 37 38 56

Back to Top