Get the right information, with visual impact, to the people who need it
Advanced ODS Graphics: Steps to think about when creating a graph

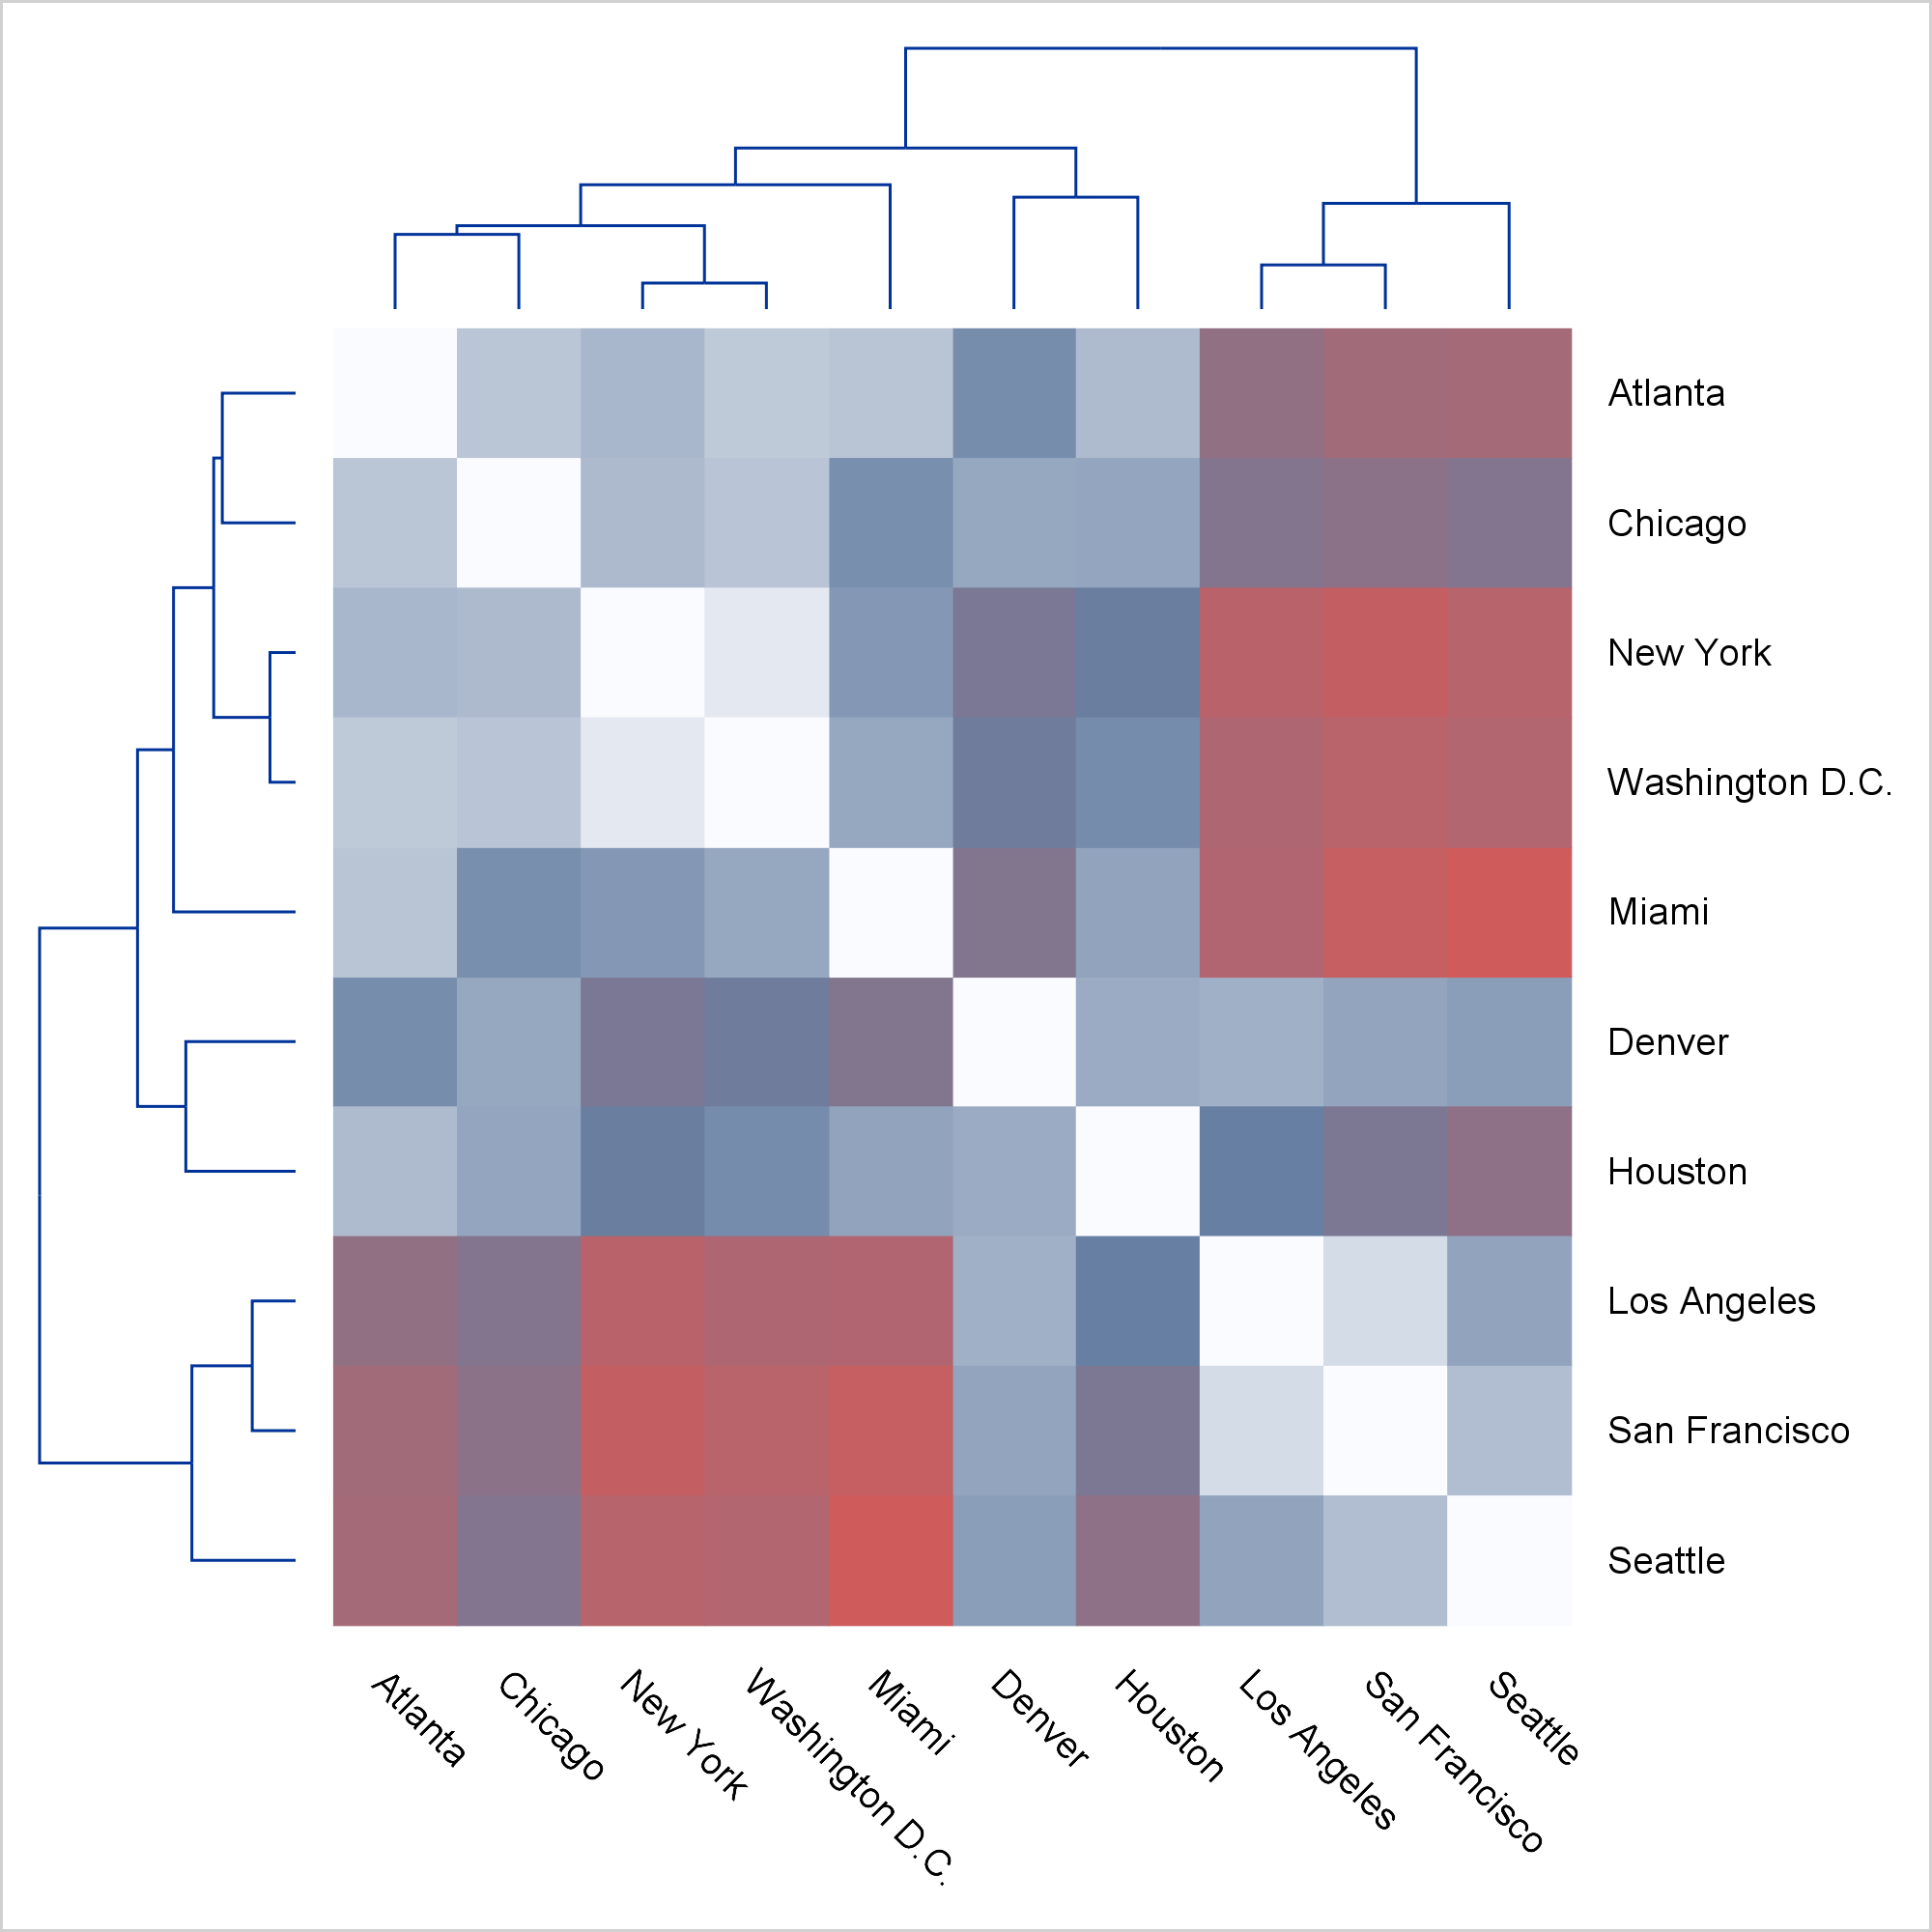
Today, I focus on the steps needed to make a graph that is composed of multiple heterogeneous components (in this case, dendrograms and a heat map).