Get the right information, with visual impact, to the people who need it
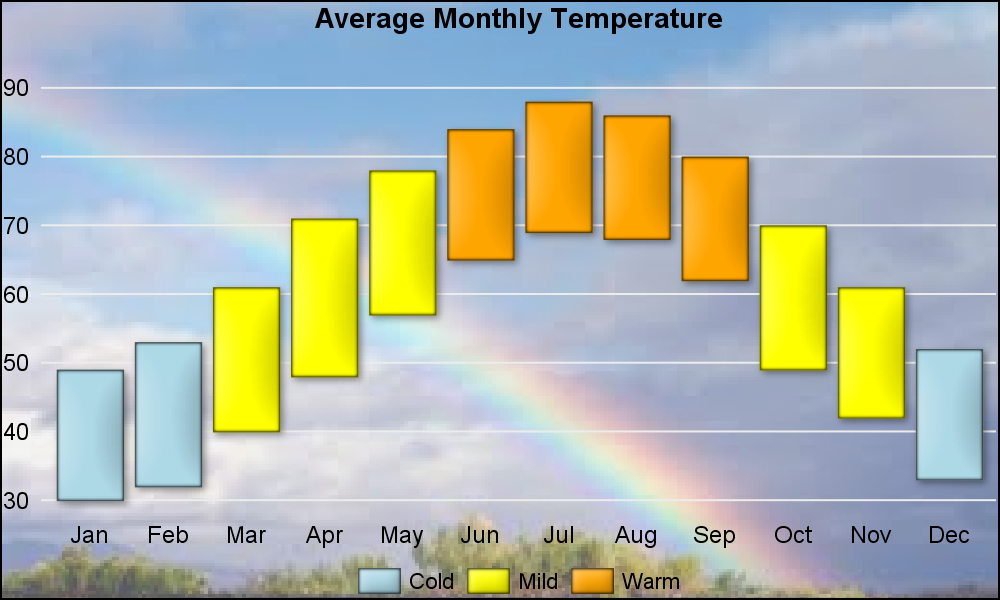
Image backgrounds

As many of the regular readers of this blog know, SGPLOT and GTL, provide extensive tools to build complex graphs by layering plot statements together. These plots work with axes, legends and attribute maps to create graphs that can scale easily to different data. There are, however, many instances where