Get the right information, with visual impact, to the people who need it
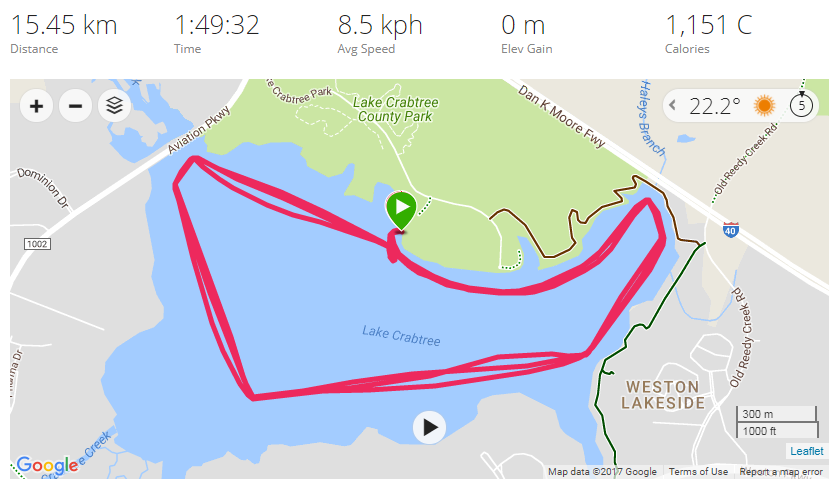
SAS and sports analytics (plotting kayak/SUP race results)

I recently paddled in a boat race, and was wondering how I did compared to all the other paddlers. And being a Graph Guy, I decided I should find a cool way to graph the data ... Here's some background information ... There's a great organization called Bridge II Sports