Data Visualization

Get the right information, with visual impact, to the people who need it
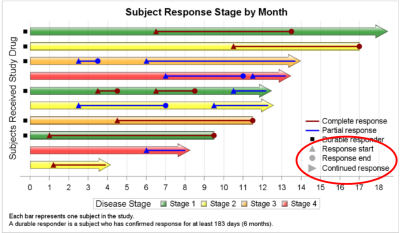
Data Visualization | Learn SAS | Programming Tips
Sanjay Matange 0
Legend items

Plot statements included in the graph definition can contribute to the legend(s).  This can happen automatically, or can be customized using the KEYLEGEND statement.  For plot statements that are classified by a group variable, all of the unique group values are displayed in the legend, along with their graphical representation

Analytics | Data Visualization
Jeanne (Hyunjin) Byun 0
분석 스토리텔링, 데이터 시각화를 이용한 설득의 기술

‘호모 나랜스(Homo Narrans)’라는 단어를 들어보셨나요? ‘이야기하는 사람’을 뜻하는 라틴어로 1999년 미국의 영문학자 존 닐(John Niels)이 동일 제목의 저서를 통해 처음 소개했습니다. 그는 인간은 태생적으로 이야기하려는 본능을 가지며, 이야기를 주고받지 않고서는 살아갈 수 없고, 이야기를 통해 사회를 이해한다고 설명했는데요. 이야기는 기억에 남으며, 사람과 감정적으로 연결되고, 행동을 고취시킵니다. ‘이야기하다’라는 뜻의 ‘스토리텔링(Storytelling)’은 지속적이며

1 245 246 247 248 249 537