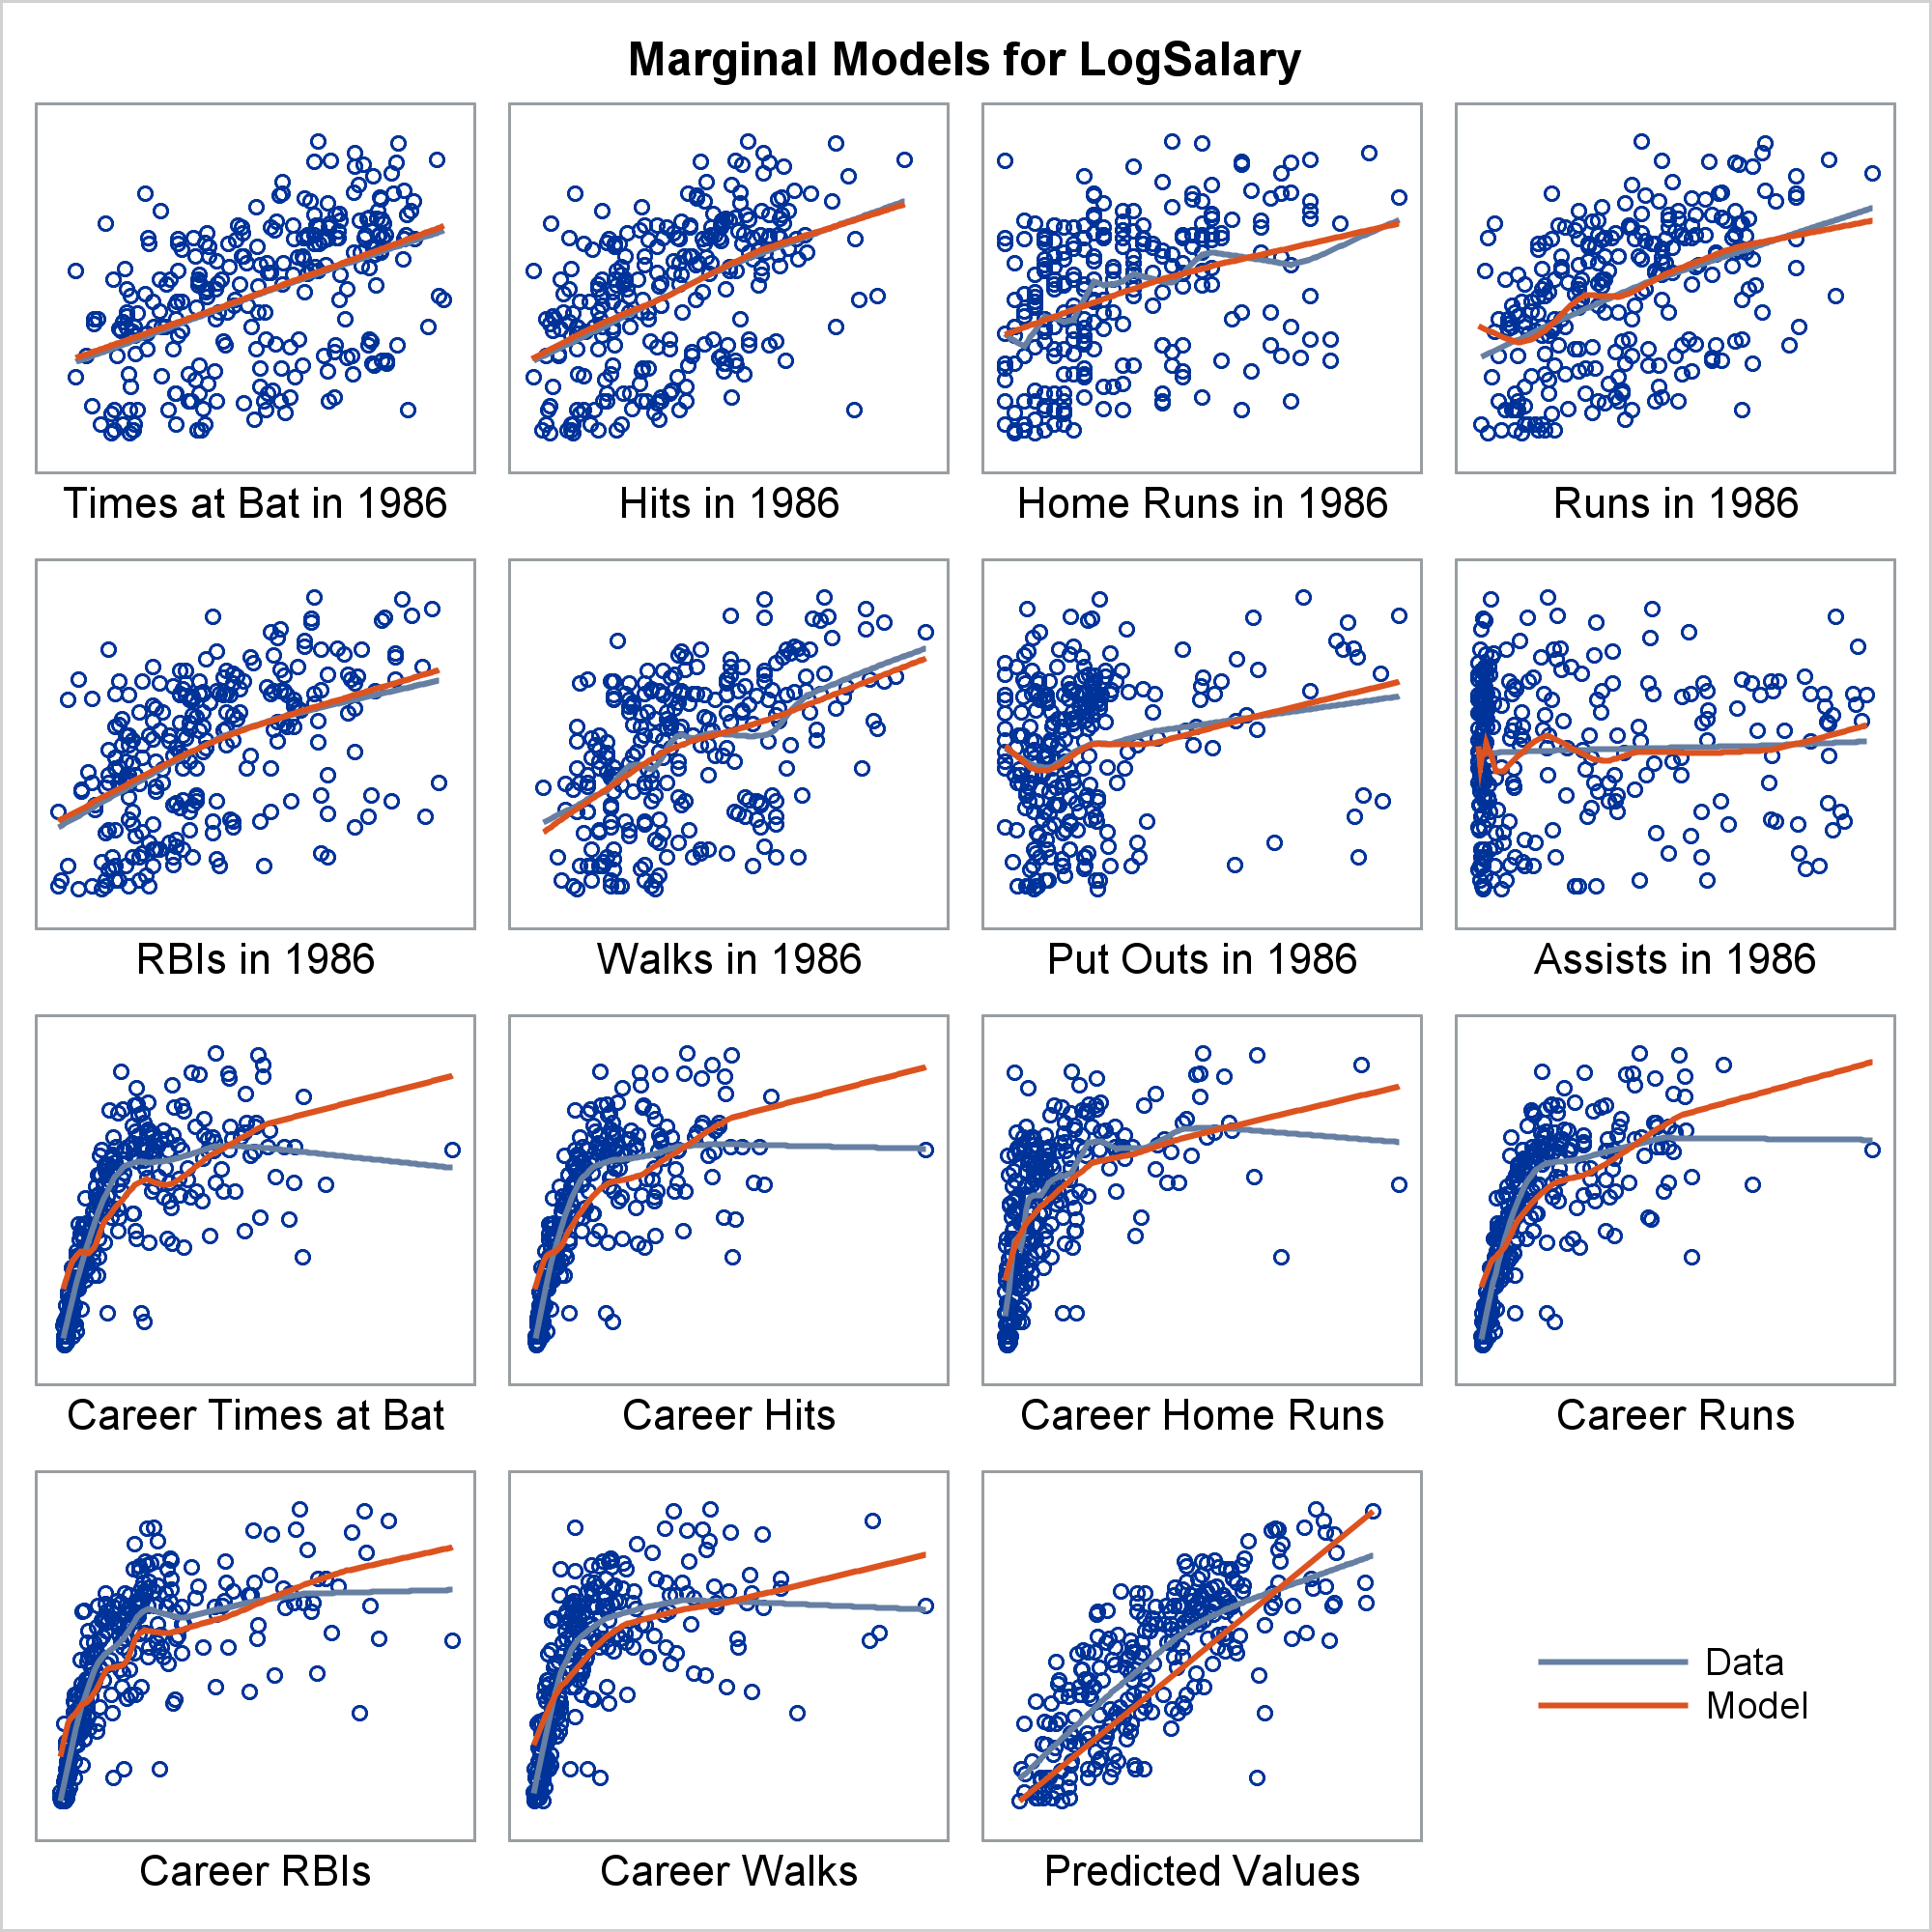
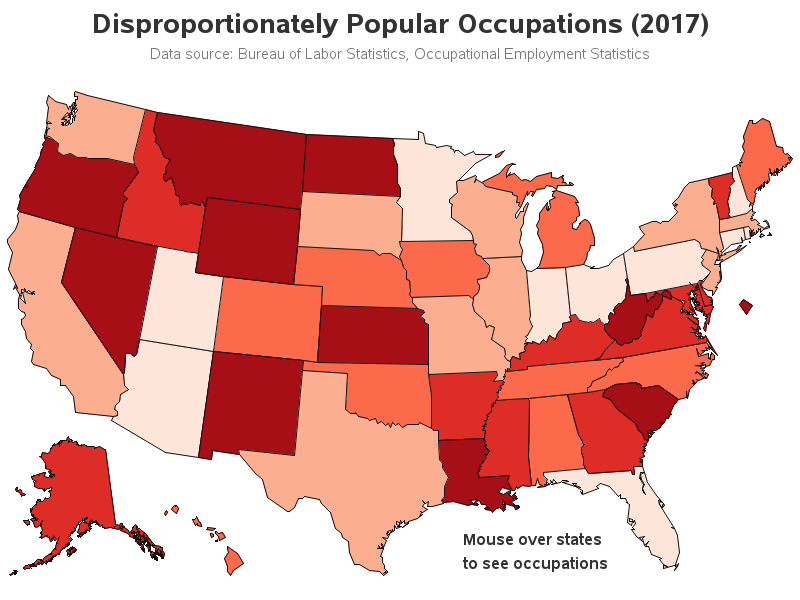
Get the right information, with visual impact, to the people who need it

La gente anda diciendo: Los beneficios detrás de las críticas de los clientes

Me considero un amante de la comida, especialmente de la que me gusta llamar “Antigourmet”. Mis lugares preferidos para comer son bodegones, cantinas, restaurantes viejos y caserones, pizzerías, clubes y carritos de la costanera. De esos que tienen patas de jamón colgando, sirven el vino en pingüino y generalmente mozos