Get the right information, with visual impact, to the people who need it
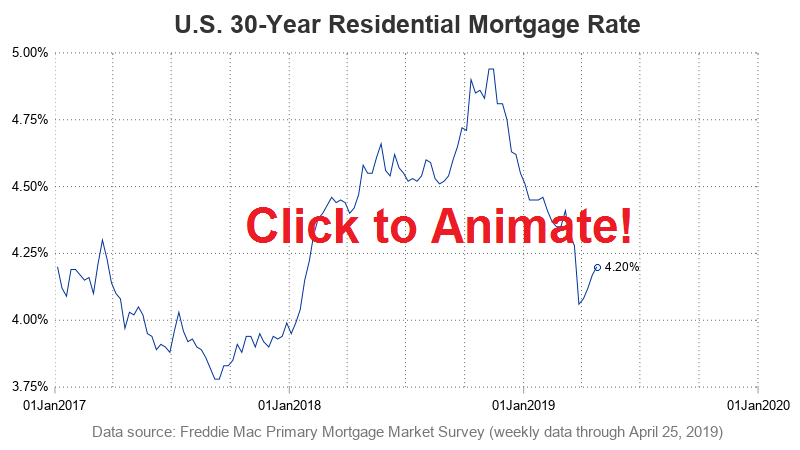
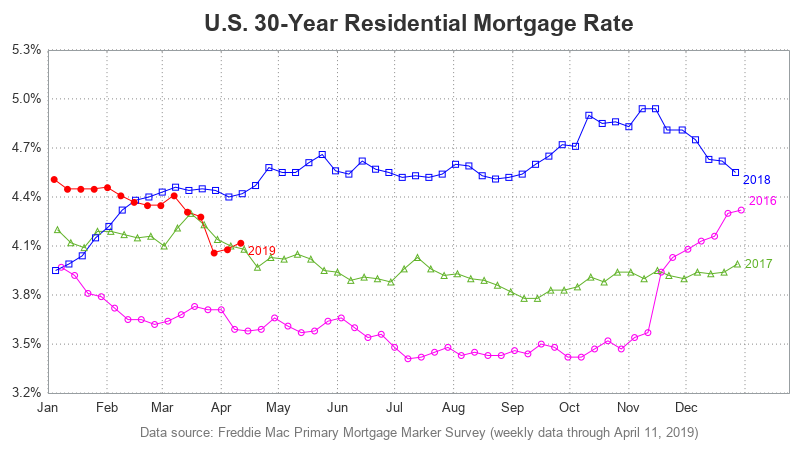
Mortgage rate graph animation

I always recommend looking at data in several different ways to get a more complete mental picture. And when the data is changing over time, one great way to view it is using an animation. Follow along for some tips & tricks to animate your own data over time. I'll