Get the right information, with visual impact, to the people who need it
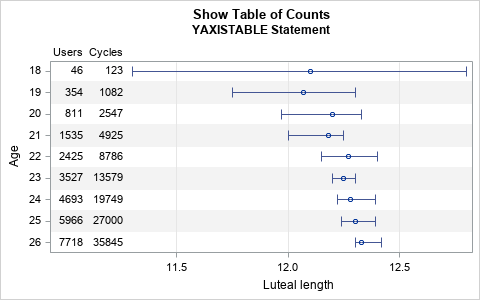
Axis tables versus rotated text: How to display a wide table in a small graph

I often use axis tables in PROC SGPLOT in SAS to add a table of text to a graph so that the table values are aligned with the data. But axis tables are not the only way to display tabular data in a graph. You can also use the TEXT