Get the right information, with visual impact, to the people who need it
セルフサービスBIの進化系、拡張アナリティクスの決定版SAS Visual Analytics 8.4 on SAS Viya拡張ポイント

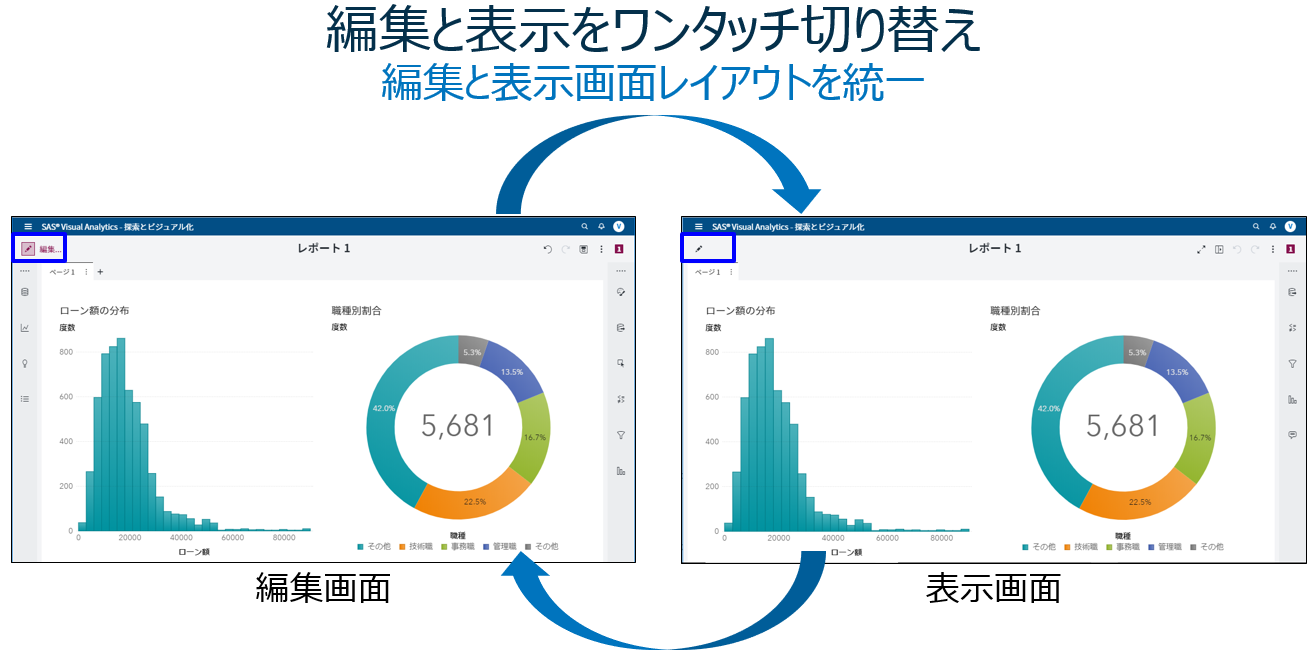
SAS Visual Analytics on SAS Viya(以降VA)の最新版8.4に搭載されている新機能の中から、以下5つの機能に関してダイジェストでご紹介します。 1.AIストーリーテラー機能 2.レポート編集&表示切替の利便性向上 3.閲覧時レポートカスタマイズ&制御 4.分析用ビジュアル候補提示 5.カスタムグループ作成の容易化 6.Visual Analytics SDK 1.AIストーリーテラー(自動分析&解説)機能 VA8.3から搭載されていた機能やUIが拡張されています。 AIストーリーテラー(自動分析&解説)機能では、分析対象の変数(ターゲット)を指定するだけで、その変数に影響を与えているその他の変数の特定や、変数ごとにどのような条件の組み合わせがターゲット変数に依存しているのかを「文章(条件文)」で表現して教えてくれます。 この例で使用するデータ「HMEQJ」は、ローンの審査を題材にしたもので、顧客ごとに1行の横持ちのデータです。このデータ内にある「延滞フラグ」が予測対象の項目(ターゲット変数)で、0(延滞なし)、1(延滞あり)の値が含まれています。 データリスト内の「延滞フラグ」を右クリックし、「説明」>「現在のページで説明」を選ぶだけで、「延滞フラグ」をターゲット変数に、その他の変数の組み合わせを説明変数とした複数の決定木(ディシジョンツリー)が実行され、 以下のような結果が表示され、見つけ出された有用な洞察を説明してくれます。 分析結果画面内説明: ① 予測対象値(0:延滞なし、1:延滞あり)の切り替えが可能です。この例では、「1:延滞あり」を選択し、「延滞する」顧客に関して分析しています。 ② 全体サマリーとして、すべての顧客の内、延滞実績のある顧客は19.95%(5,960件中の1,189件)であることが示されています。 ③ 「延滞する」ことに関して影響を与えている変数の重要度を視覚的に確認することができます。最も影響度の高い変数(今回は「資産に対する負債の割合」)の重要度を1として、1を基準値にした相対重要度が算出され、横棒グラフで表示されます。従来版に比べて、変数ごとの影響度合いの違いを明確に捉えることができます。 ④ 「高」タブには、「延滞する」可能性が高いトップ3のグループ(条件の組み合わせ)が文章で示され、「低」タブには、「延滞する」可能性が低いトップ3のグループ(条件の組み合わせ)が文章で示されます。この例では、③で「資産価値」が選択され、「資産価値」に基づき、延滞する可能性の高い/低いグループのトップ3が表示され、「資産価値」に関する条件部分がハイライトしています。 ⑤ この例では、③で「資産価値」が選択され、これに応じて「0:延滞なし、1:延滞あり」別の顧客の分布状況がヒストグラムで表示されています。選択された変数が数値属性の場合は、ヒストグラムで、カテゴリ属性の場合は積み上げ棒グラフで表示されます。チャートの下端では、チャートから読み取れる内容を文章で解説しています。 以下は、カテゴリ属性の変数を選択した場合の表示例です。 以上のように、分析スキルレベルの高くないビジネスユーザーでも、簡単かつ容易に、そして分かり易くデータから有効な知見を得ることができます。 ※AIストーリーテラー機能に関しては、SAS Viya特設サイトのビジュアライゼーションセクションで動画でもご覧いただけます。 2.レポート編集&表示切替の利便性向上 従来のVAでは、編集モードで作成したレポートを表示モードで確認する際には、メニューから「レポートを開く」を選択し、レポートが表示されるのを少し待つ必要がありました。また、レポート表示モードから編集モードに戻るにもメニューから「編集」を選択する必要がありました。 VA8.4では、編集モードと表示モード切替の利便性が改善され、画面左上のペンシルアイコンをクリックするだけで、編集画面<->表示画面間を瞬時に切り替えられるので作業効率が向上します。 また、ご覧の通り、編集画面と表示画面のレイアウトも統一されています。 3.閲覧時レポートカスタマイズ&制御 一般的にBIツールでは、対象ユーザーを3つの層(管理者、レポート作成者(デザイナ)、レポート閲覧者(コンシューマ))に分類し、それぞれに最適なインターフェースを提供しています。しかし、レポート閲覧者の中には、「基本的には誰かが作成したレポートを見るだけでいいんだけど、自分好みに変更できたらもっといいのにな…」という声も多くあります。このレポートカスタマイズ者層に答えられないために、彼らは、レポートを開き、そのデータをダウンロードし、Excelに取り込んで好みのレポートを作成しようとするのです。 VA8.4では、レポートカスタマイズ者層向けに、作成済みレポートを開いて閲覧中に、簡単操作で好みに合うようにレポートをカスタマイズすることができるようになりました。 以下は、レポート閲覧中に「円グラフ」を他のチャートタイプに変更するメニューが表示されている例です。 また、レポート作成者は、レポートカスタマイズ者向けに、カスタマイズ可能な機能範囲を3段階で制御することが可能です。 これで、レポート作成者の負担も軽減され、レポート閲覧者の痒いところに手が届きそうですね。 4.分析用ビジュアル候補提示 レポート作成の元となるデータソースを選択すると、そのデータソース内の項目に基づき、「こんな分析が有効じゃないの…」と、分析画面の候補を自動的に提示してくれる機能です。 画面左端から電球マークの「候補」アイコンをクリックすると、分析候補がいくつか表示され、提示された分析画面をドラッグ操作でレポートに挿入することができます。 より素早く、効果的な情報を含むレポートを作成することができそうですね。これも一つの自動分析機能です。 5.カスタムグループ作成の容易化 従来版のVAでは、カスタムグループを作成する際には、カスタムグループ作成専用の画面内で、グループに含める要素の選択と、グループ名称を設定し、OKをクリックしてチャートに反映させる必要がありましたが、VA8.4では、チャート上でグループ化対象の要素を選択し、そのグループに名称を設定して、素早くカスタムグループを作成することができるようになりました。 6. Visual Analytics SDK