Response Colors and Thickness

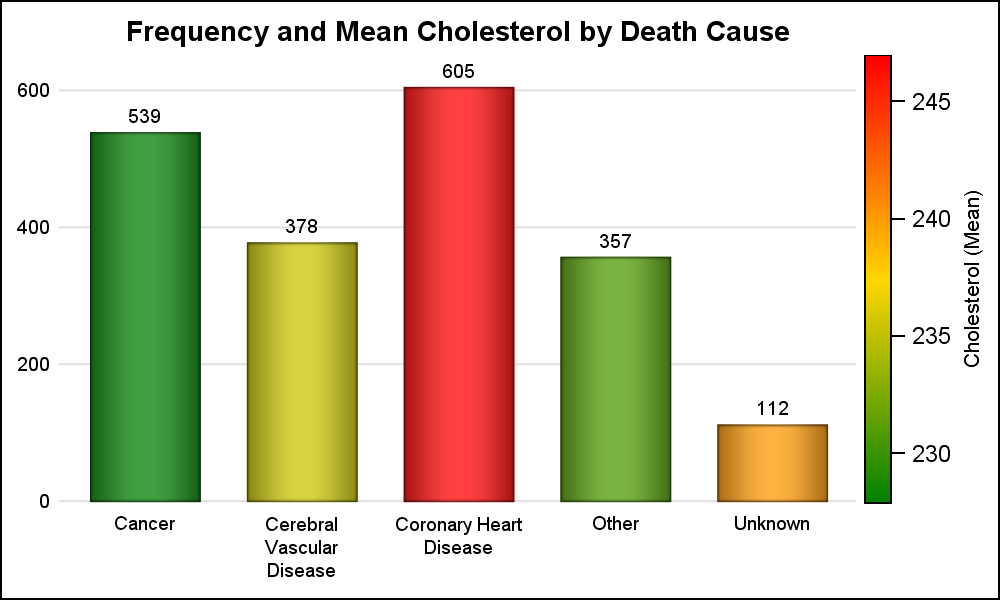
Often there is a need to display more than one response simultaneously for a bar chart, series plot or a vector plot. SAS 9.40M3 adds the options you need to get such results using two new options COLORRESPONSE and THICKRESPONSE where applicable. The Bar Chart on the right shows the frequency