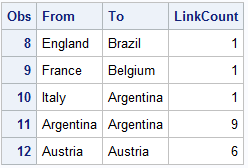
Tag: Text Plot

Data Visualization
Sanjay Matange 0
Likert Graph Revisited

A few weeks back I posted an article on ways to create a WindRose Graph using SGPLOT procedure.  The process is relatively simple.  Create (R, Theta) data with both numeric axes where the Theta is a value in the data range is 0-360, and R is the corresponding response value.  Then

Data Visualization
Sanjay Matange 0
Polar Graph

There are many situations where it is beneficial to display the data using a polar graph.  Often your data may contain directional information.  Or, the data may be cyclic in nature, with information over time by weeks, or years.  The simple solution is to display the directional or time data