Tag: Statistical Graphics

Rick Wicklin 0
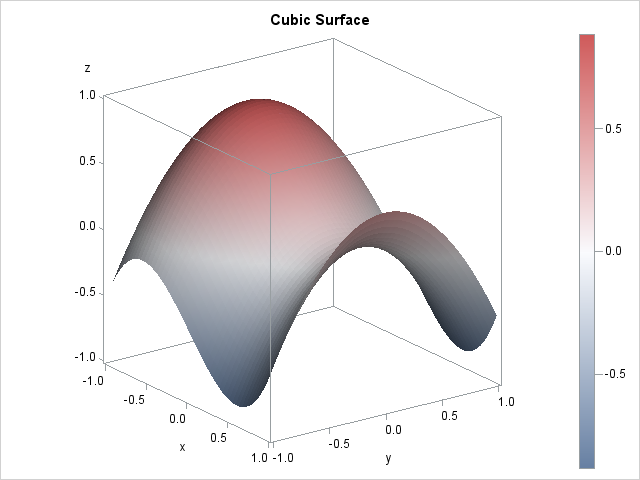
Create a surface plot in SAS

This article shows how to visualize a surface in SAS. You can use the SURFACEPLOTPARM statement in the Graph Template Language (GTL) to create a surface plot. But don't worry, you don't need to know anything about GTL: just copy the code in this article and replace the names of

Rick Wicklin 0
Error distributions and exponential regression models

Last week I discussed ordinary least squares (OLS) regression models and showed how to illustrate the assumptions about the conditional distribution of the response variable. For a single continuous explanatory variable, the illustration is a scatter plot with a regression line and several normal probability distributions along the line. The

Rick Wicklin 0
Regression coefficient plots in SAS

Last week's post about odds ratio plots in SAS made me think about a similar plot that visualizes the parameter estimates for a regression analysis. The so-called regression coefficient plot is a scatter plot of the estimates for each effect in the model, with lines that indicate the width of

1 72 73 74 75 76 103