Tag: Spline

Data Visualization
Sanjay Matange 0
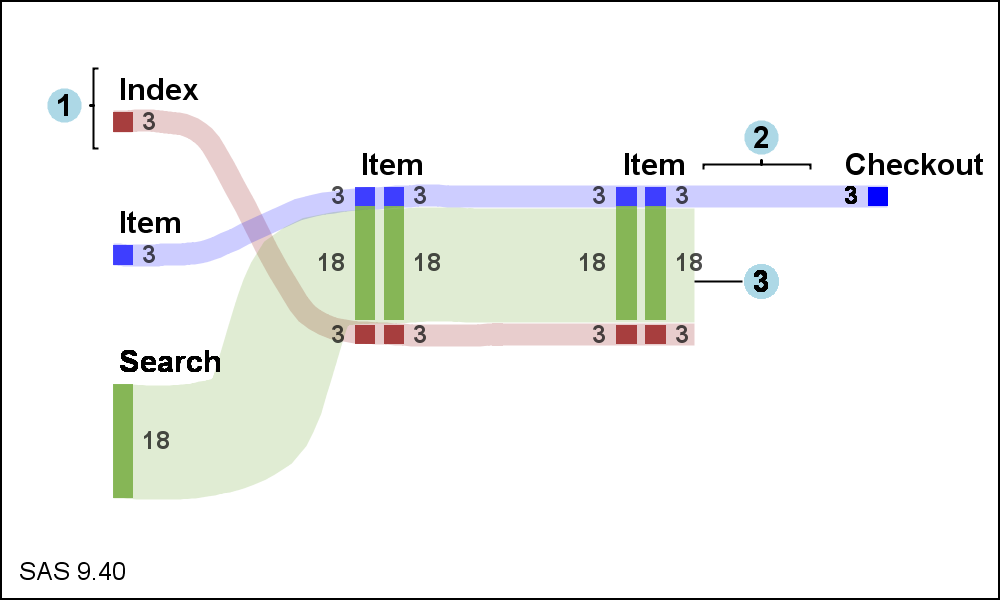
Diagrams with curved links

Let us continue with our journey beyond standard plots and charts.  Often we need to create some simple diagrams to visualize the connections between different entities such as patients and providers or even a social network. Many of you may not have a custom tool to create diagrams.  But you have Base SAS, so

Data Visualization
Sanjay Matange 0
Sankey Diagrams

Sankey Diagrams have found increasing favor for visualization of data.  This visualization tool has been around for a long time, traditionally used to visualize the flow of energy, or materials.   . Now to be sure, GTL does have a statement design for a Sankey Diagram which was implemented only in Flex for use