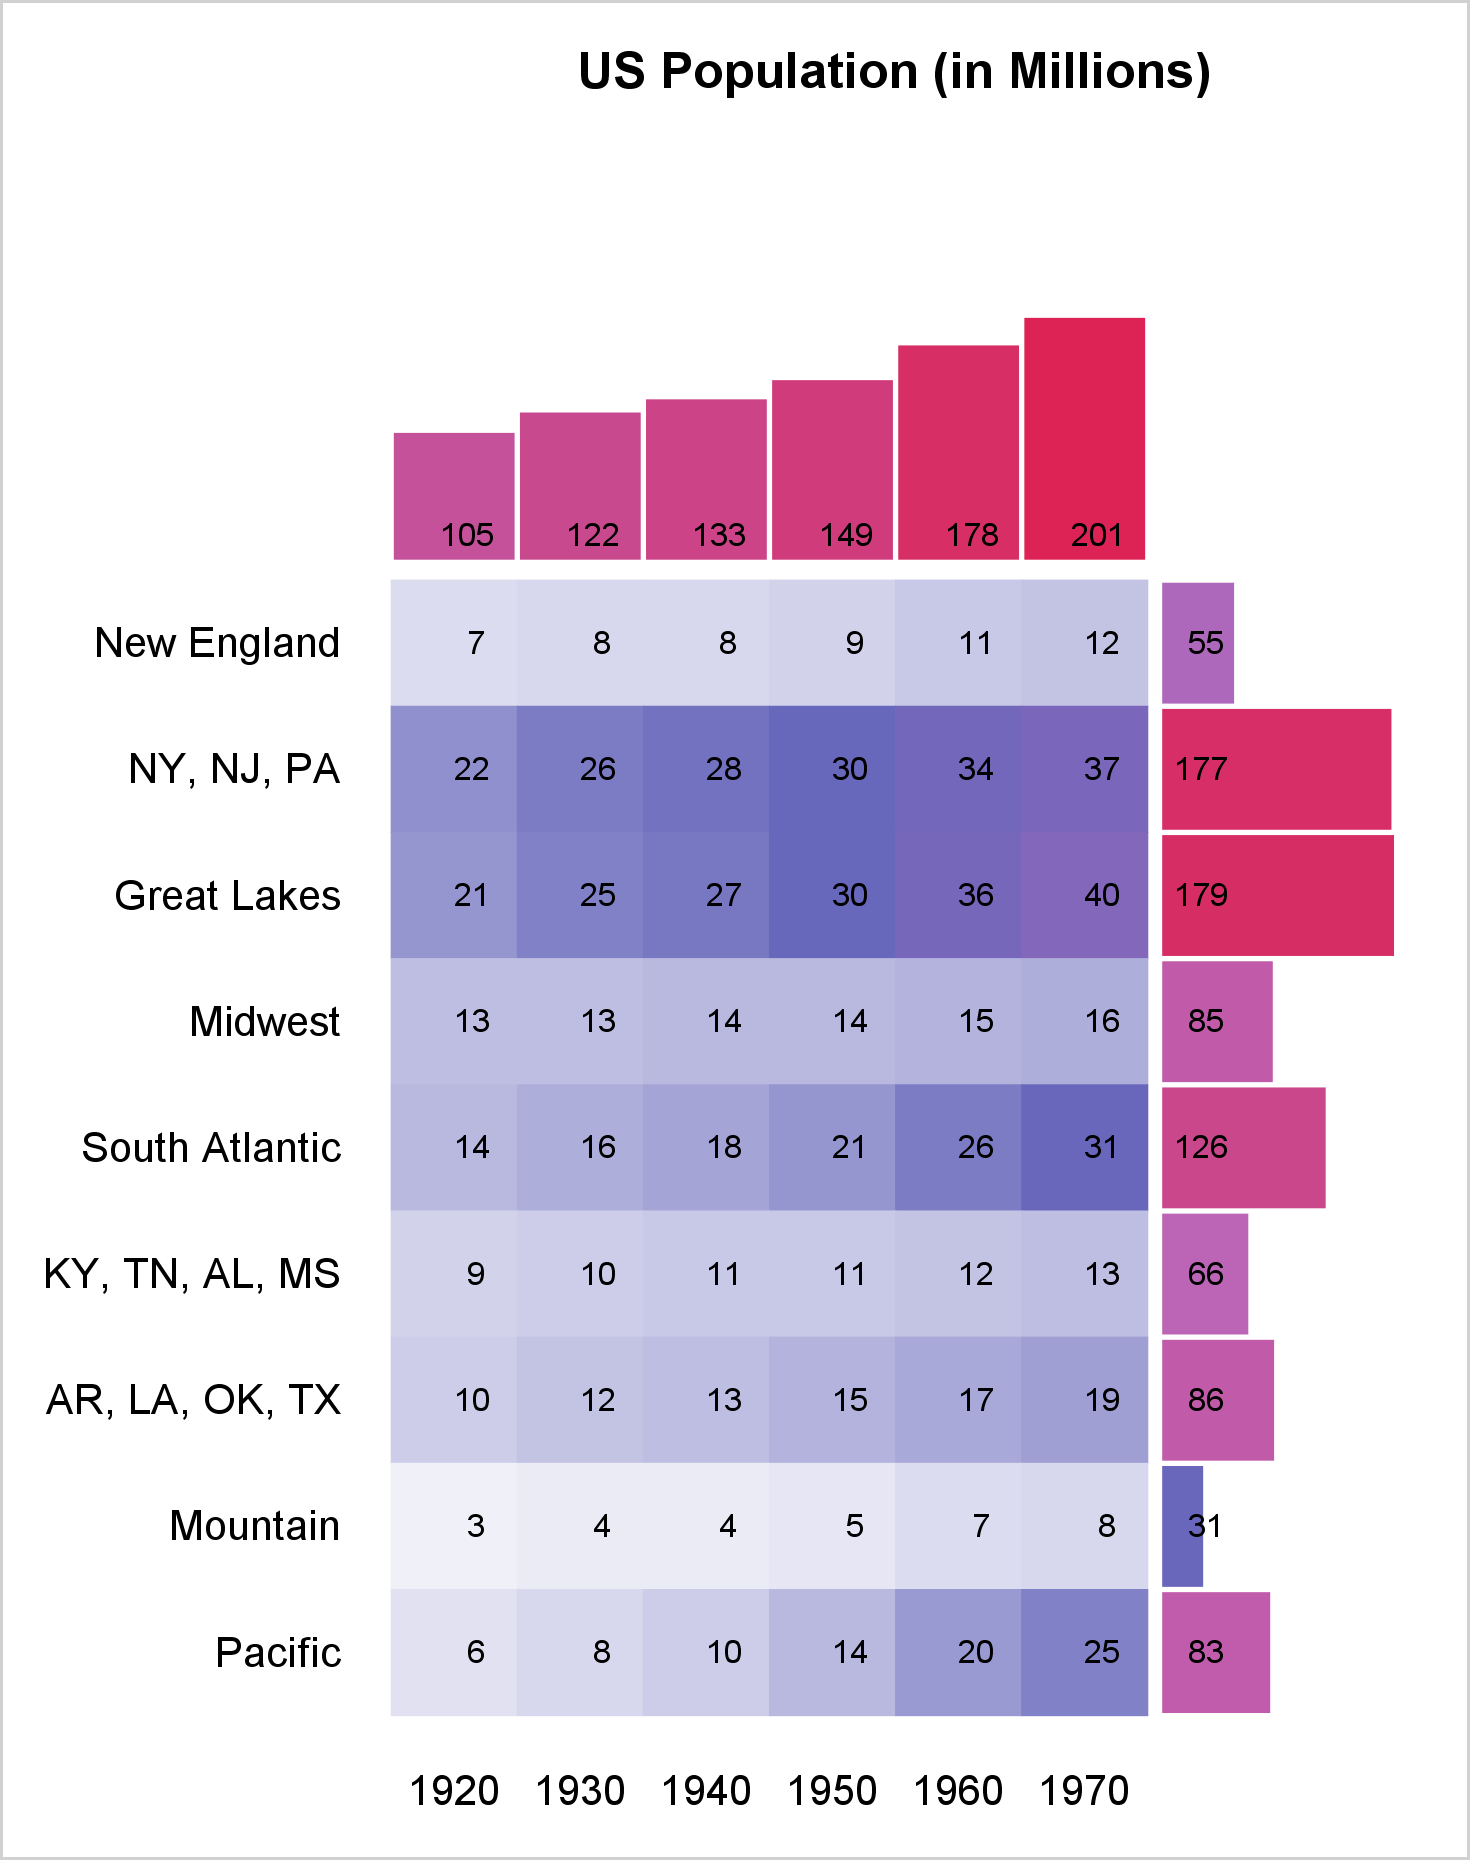
You can use a range attribute map to control the mapping of values in a continuous variable to colors. This post shows you how to use PROC SGPLOT to display multiple plots in the same graph and use range attribute maps.
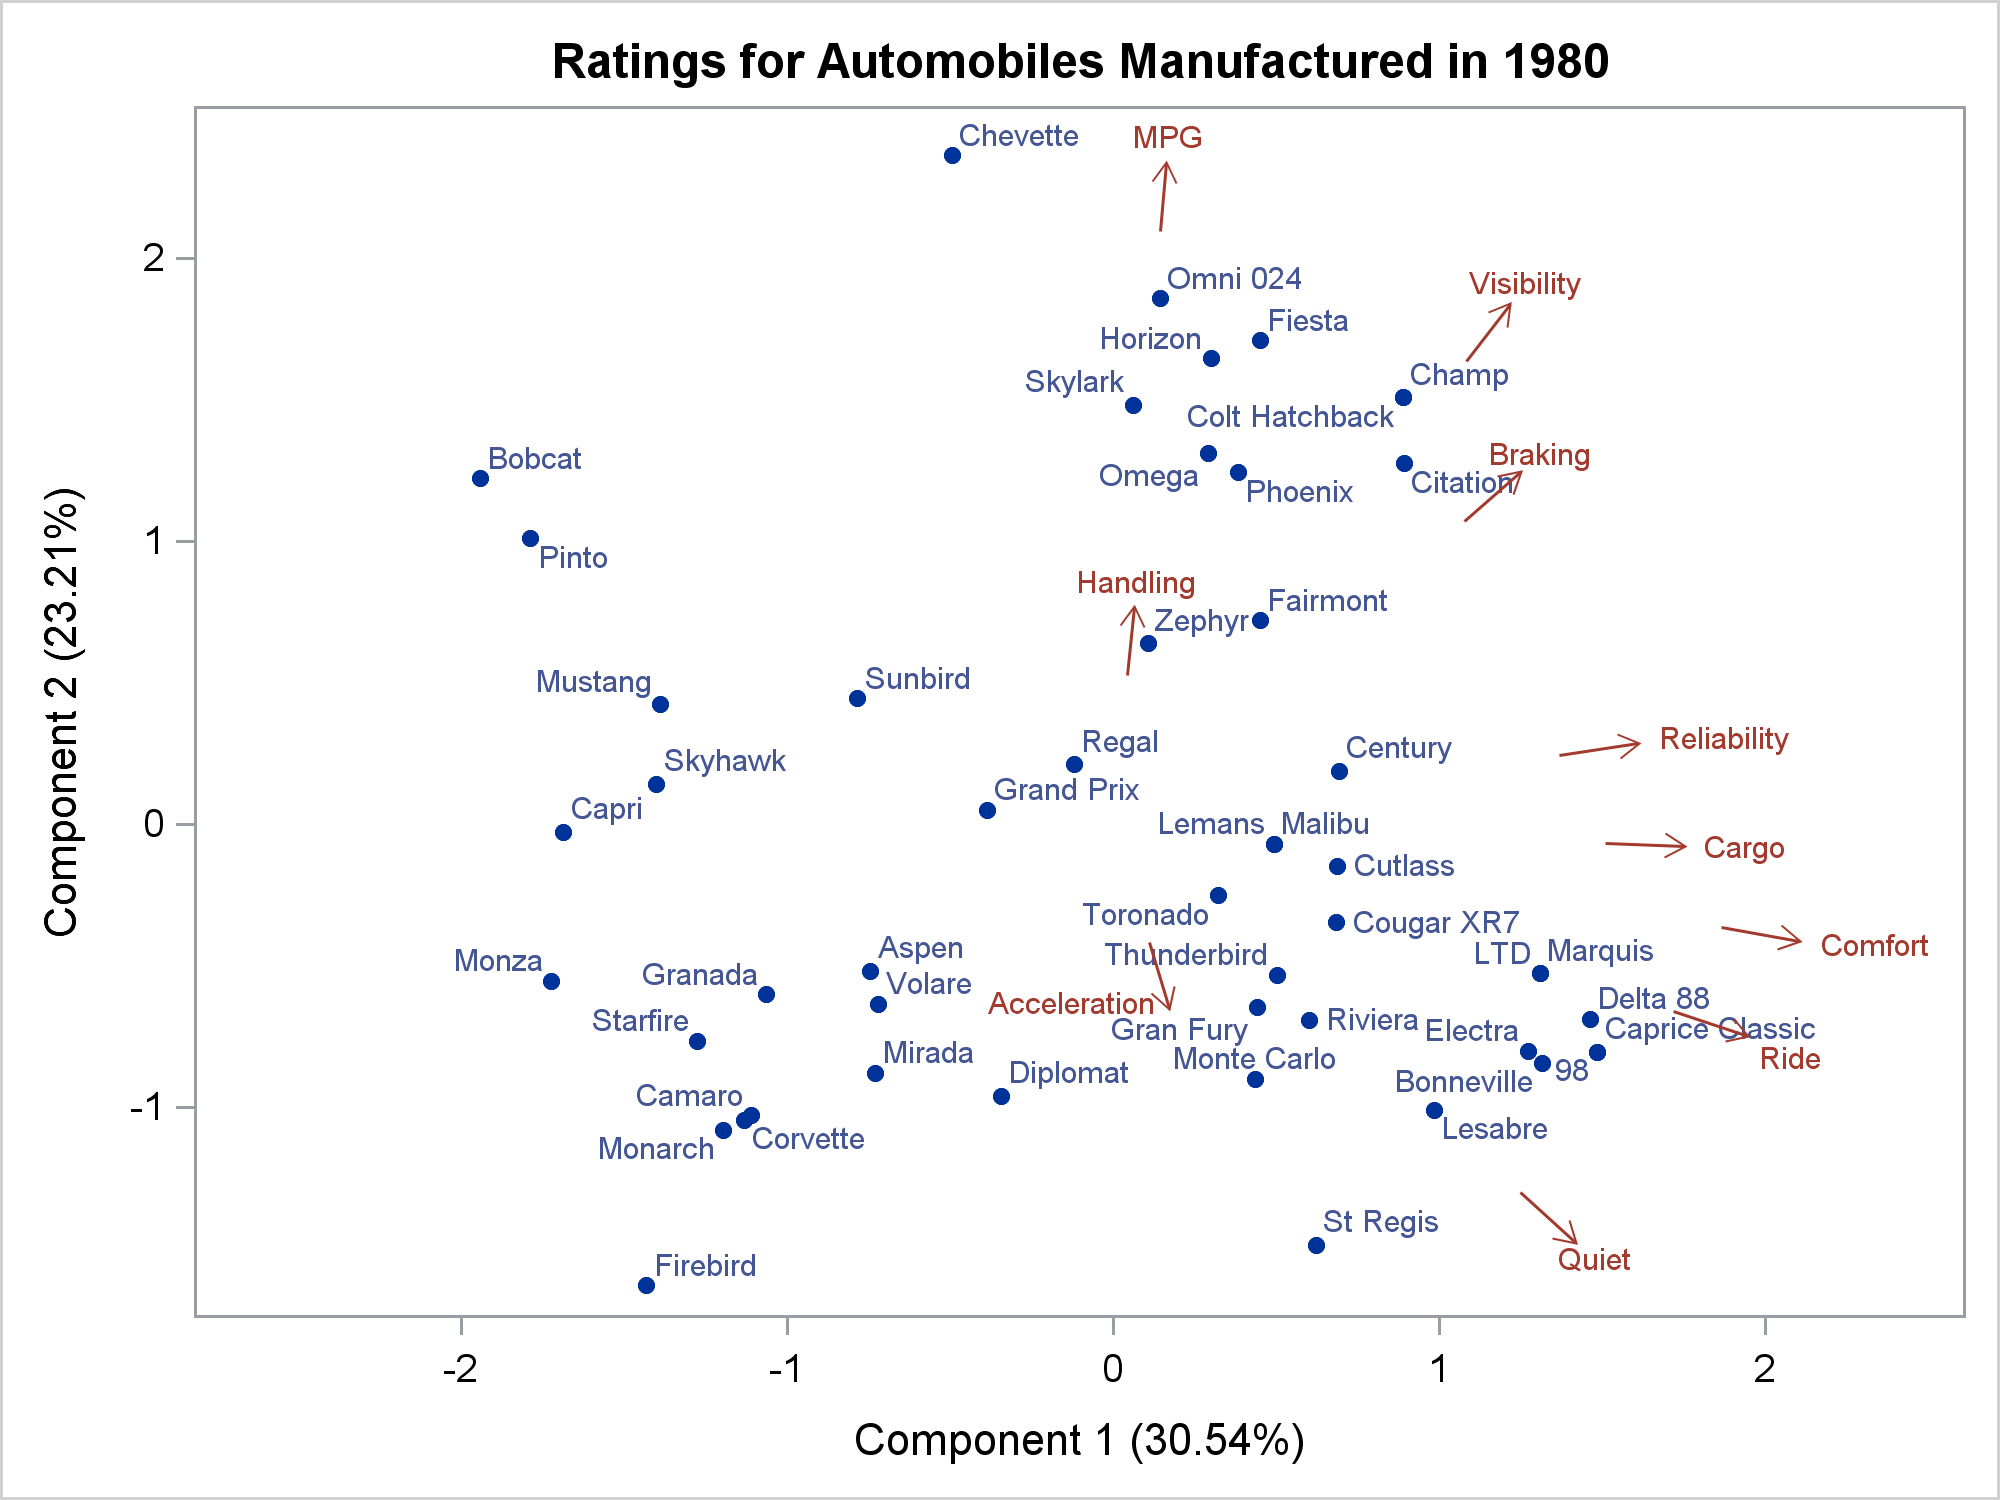
A vector plot draws a line from one point in a graph to another point. In this post, I will show you how to create short vectors instead of vectors that emanate from the origin. I also show how to modify the positions of the vector labels.
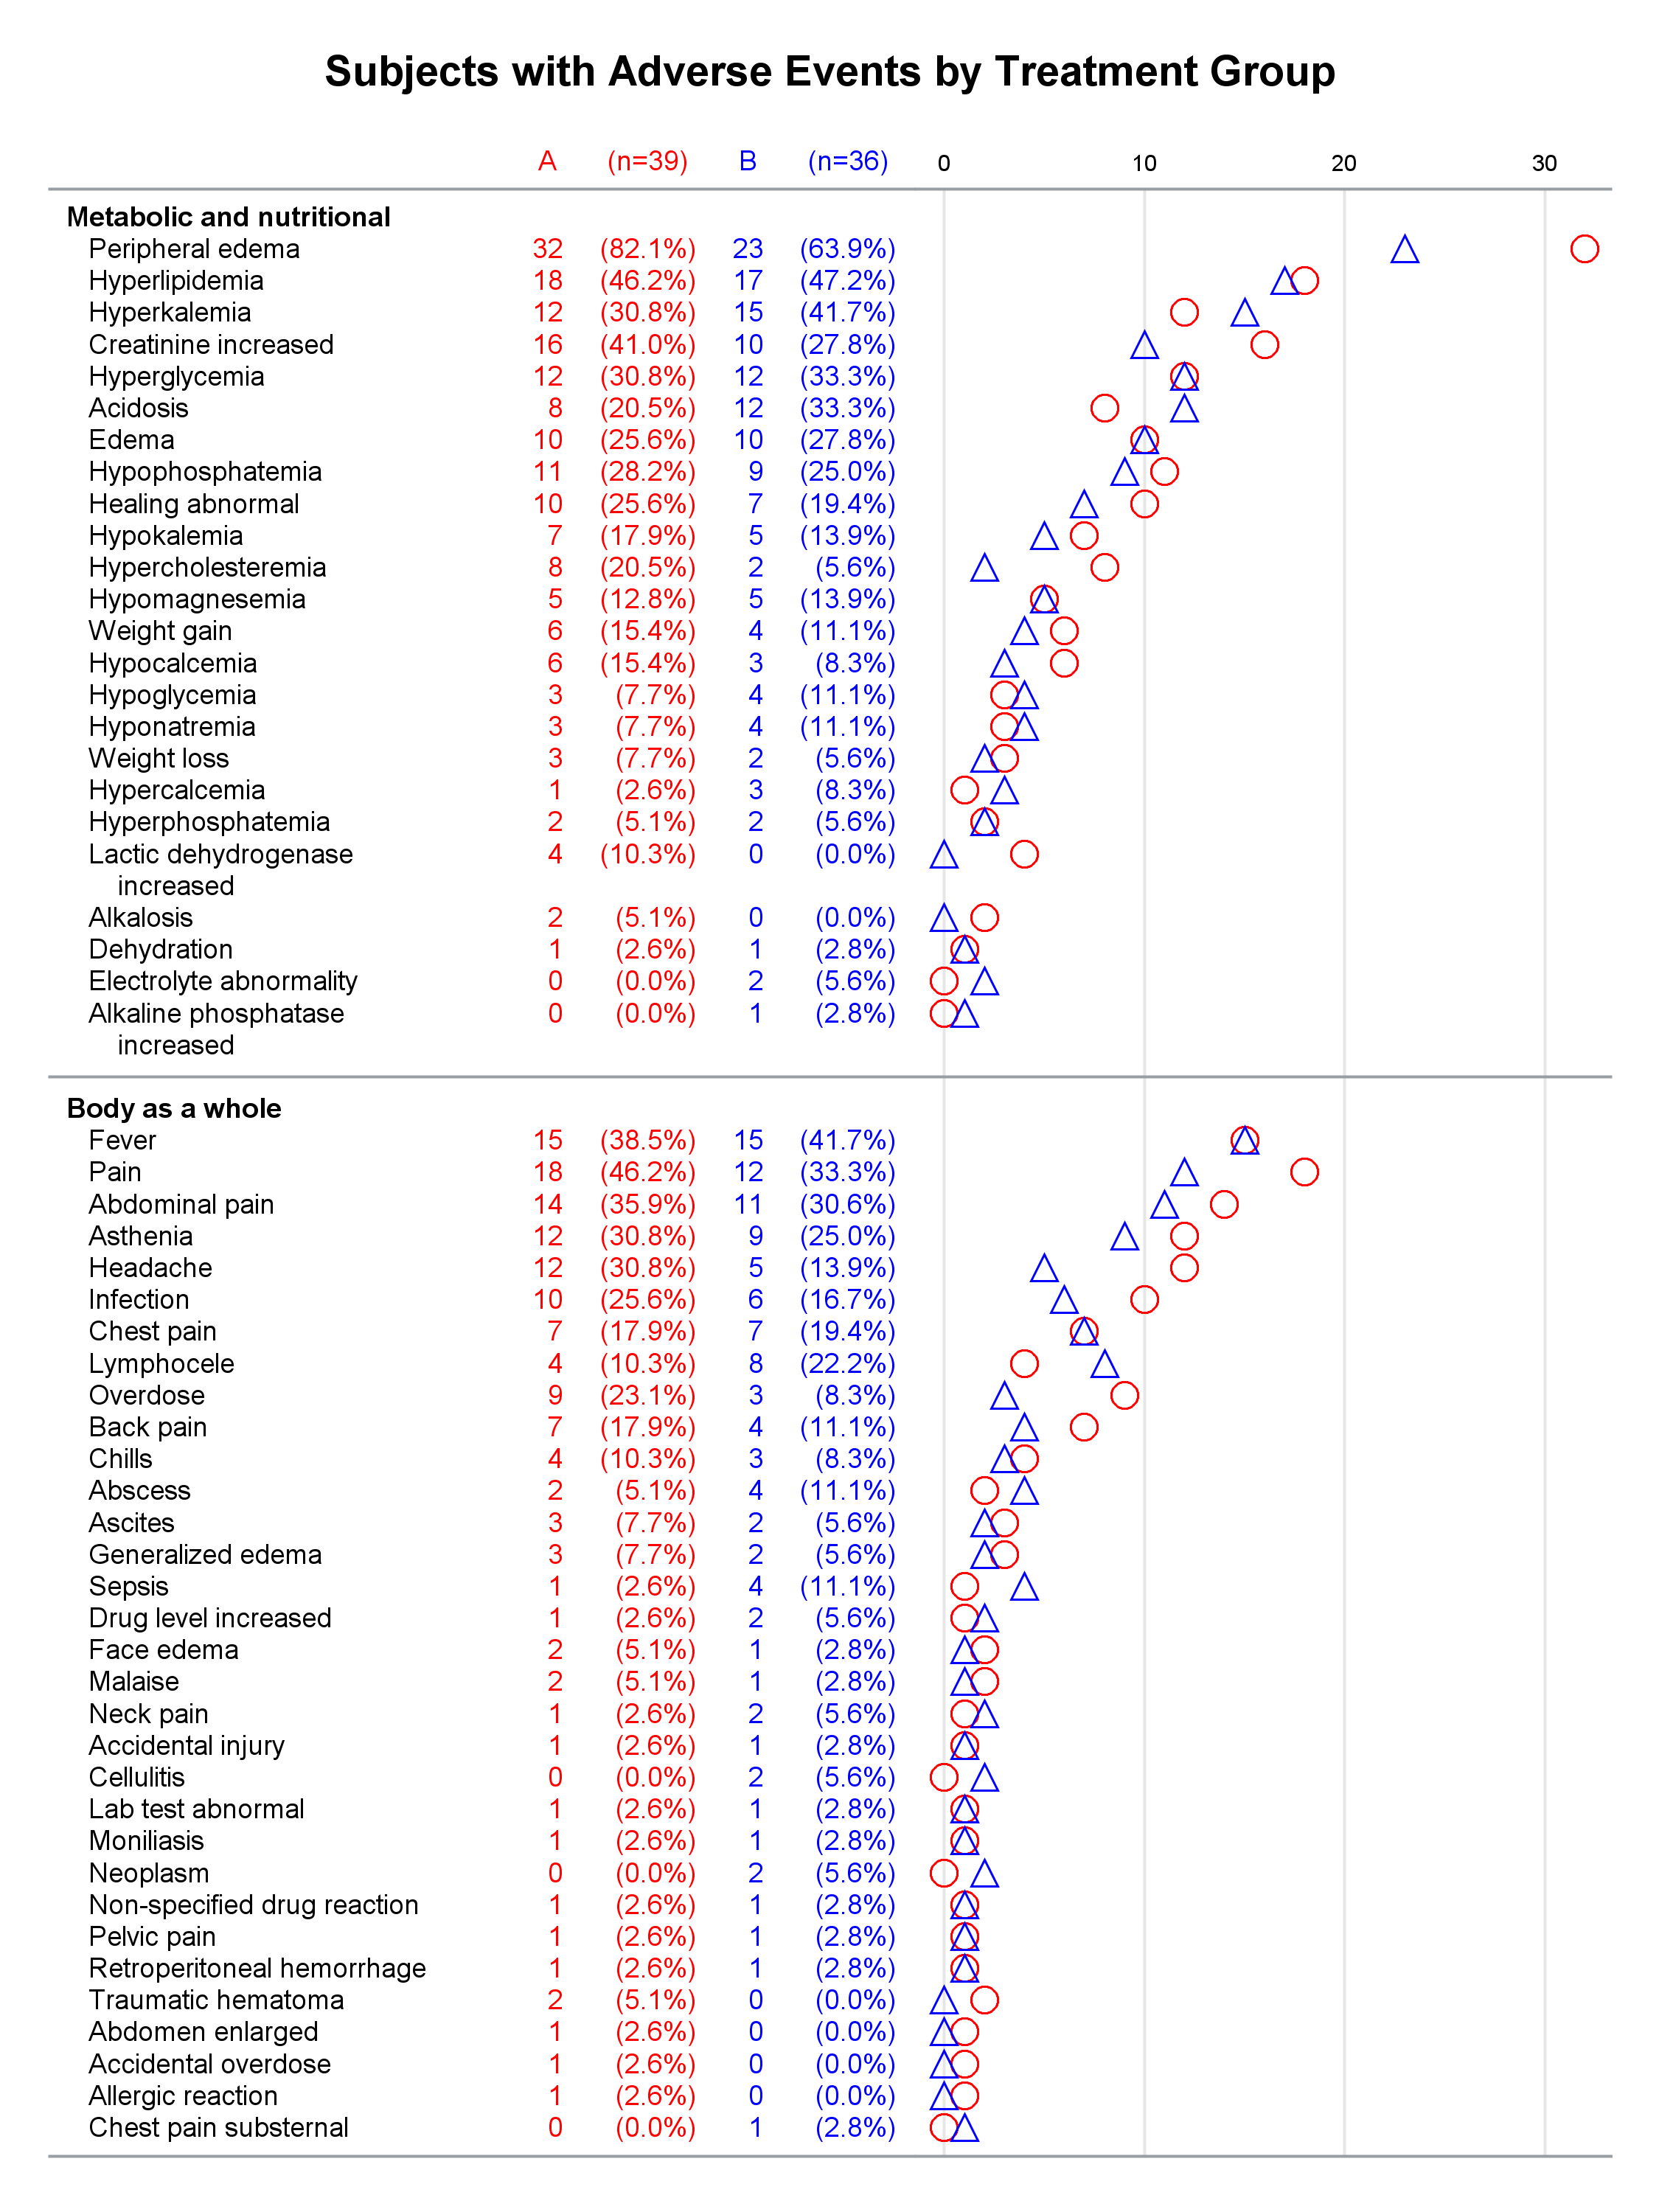
Did you know that you can make a graph extend across multiple pages? Making a multipage graph poses no problem for ODS Graphics---you simply use a BY variable to create page breaks. Most of the work involves deciding where to break pages and properly labeling continuations.