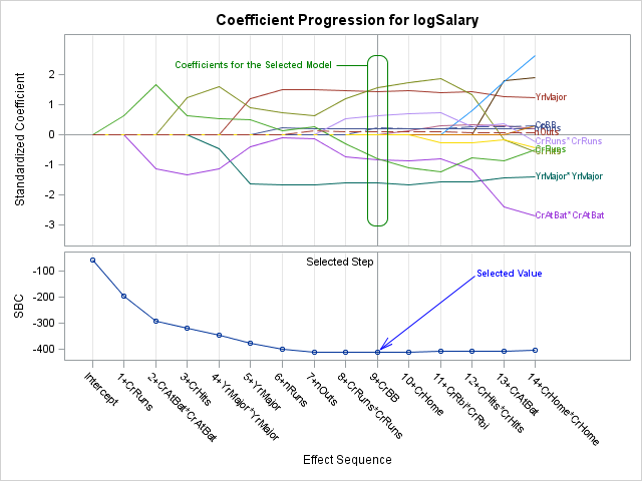
SG annotation is a powerful technique for adding text, lines, arrows, shapes, and images to graphs. This post provides a macro that can help you when you make a mistake in writing the annotations.
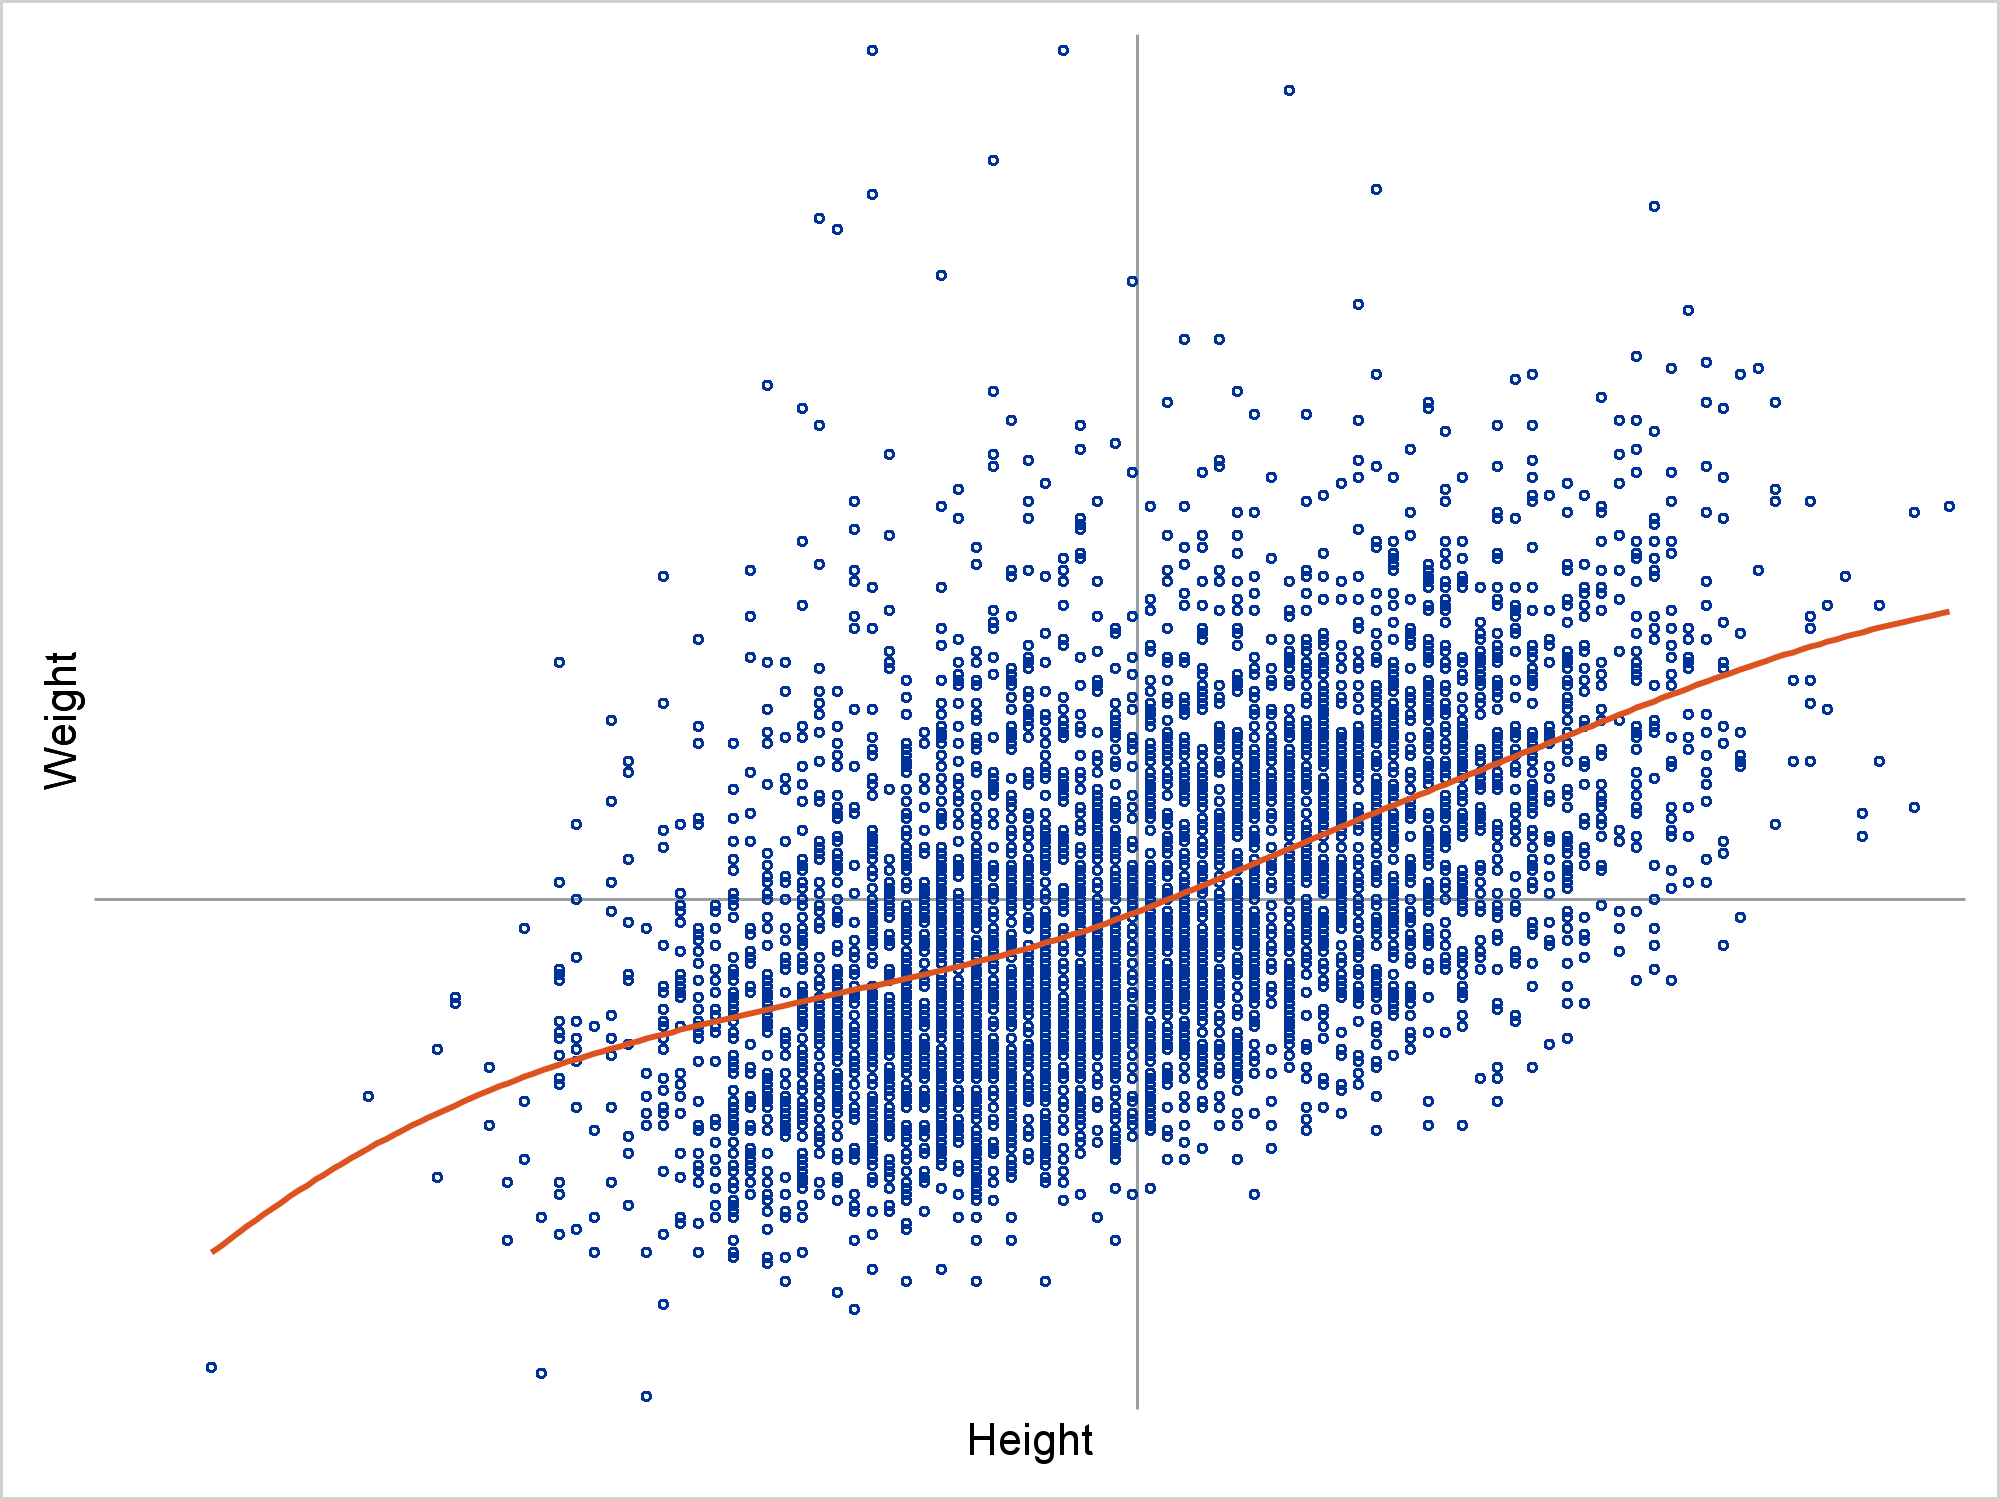
In this post, I will review some of graphs from previous posts while concentrating on just the axes, grid lines, and reference lines. They might not be the most exciting parts of a graph, but there are multiple options that when properly used can turn a good graph into a great graph.
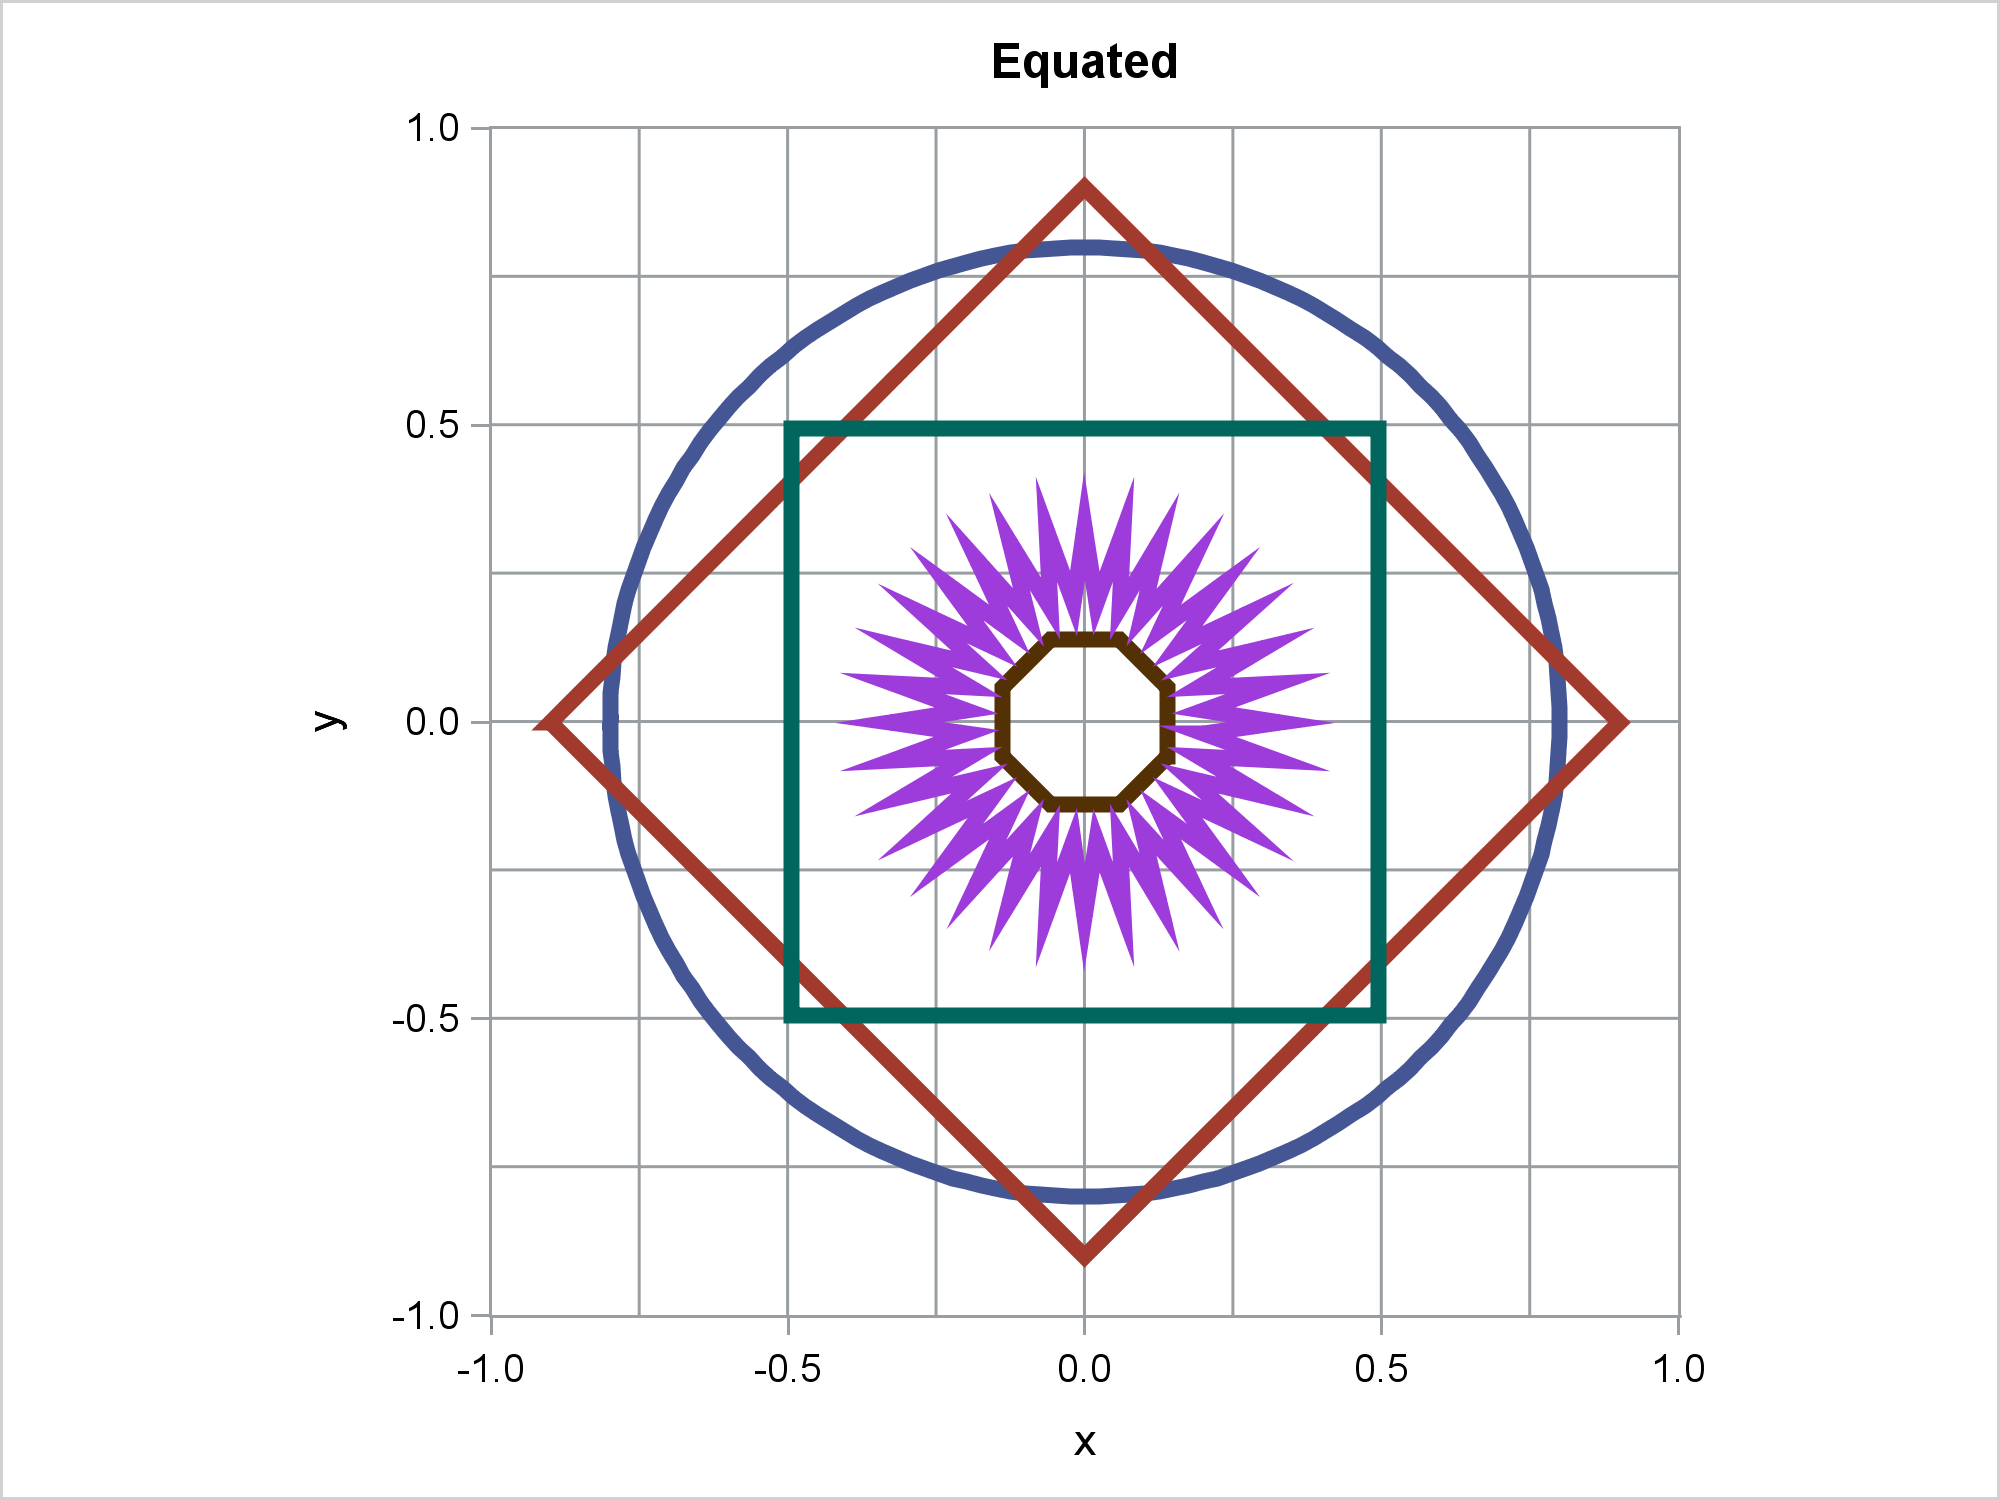
When displaying maps, geometric shapes (such as circles), or results of certain analyses, it is important to equate axes. This post illustrates options in PROC SGPLOT that enable you to equate axes.