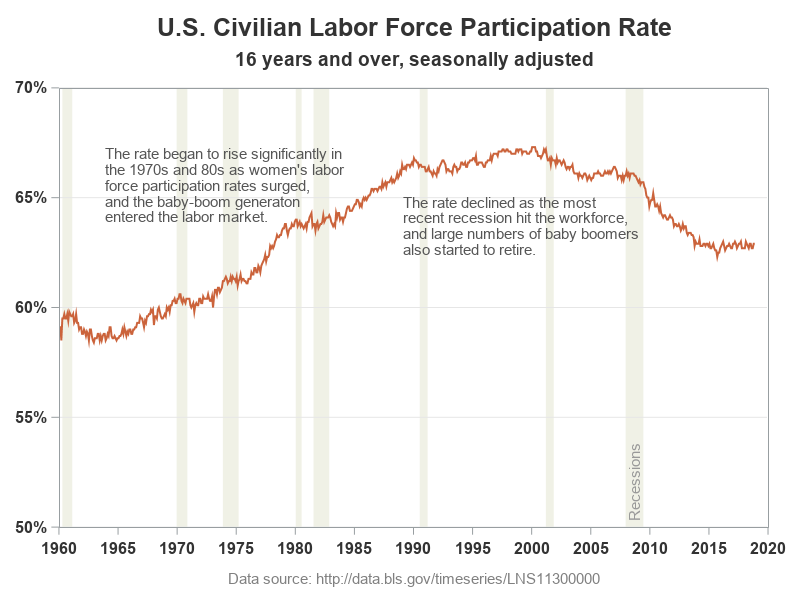
How to show recessions on your SGplot line graph

Plotting just your data often helps you gain insight into how it has changed over time. But what if you want to know why it changed? Although correlation does not always imply causation, it is often useful to graph multiple things together, that might logically be related. For example, recessions