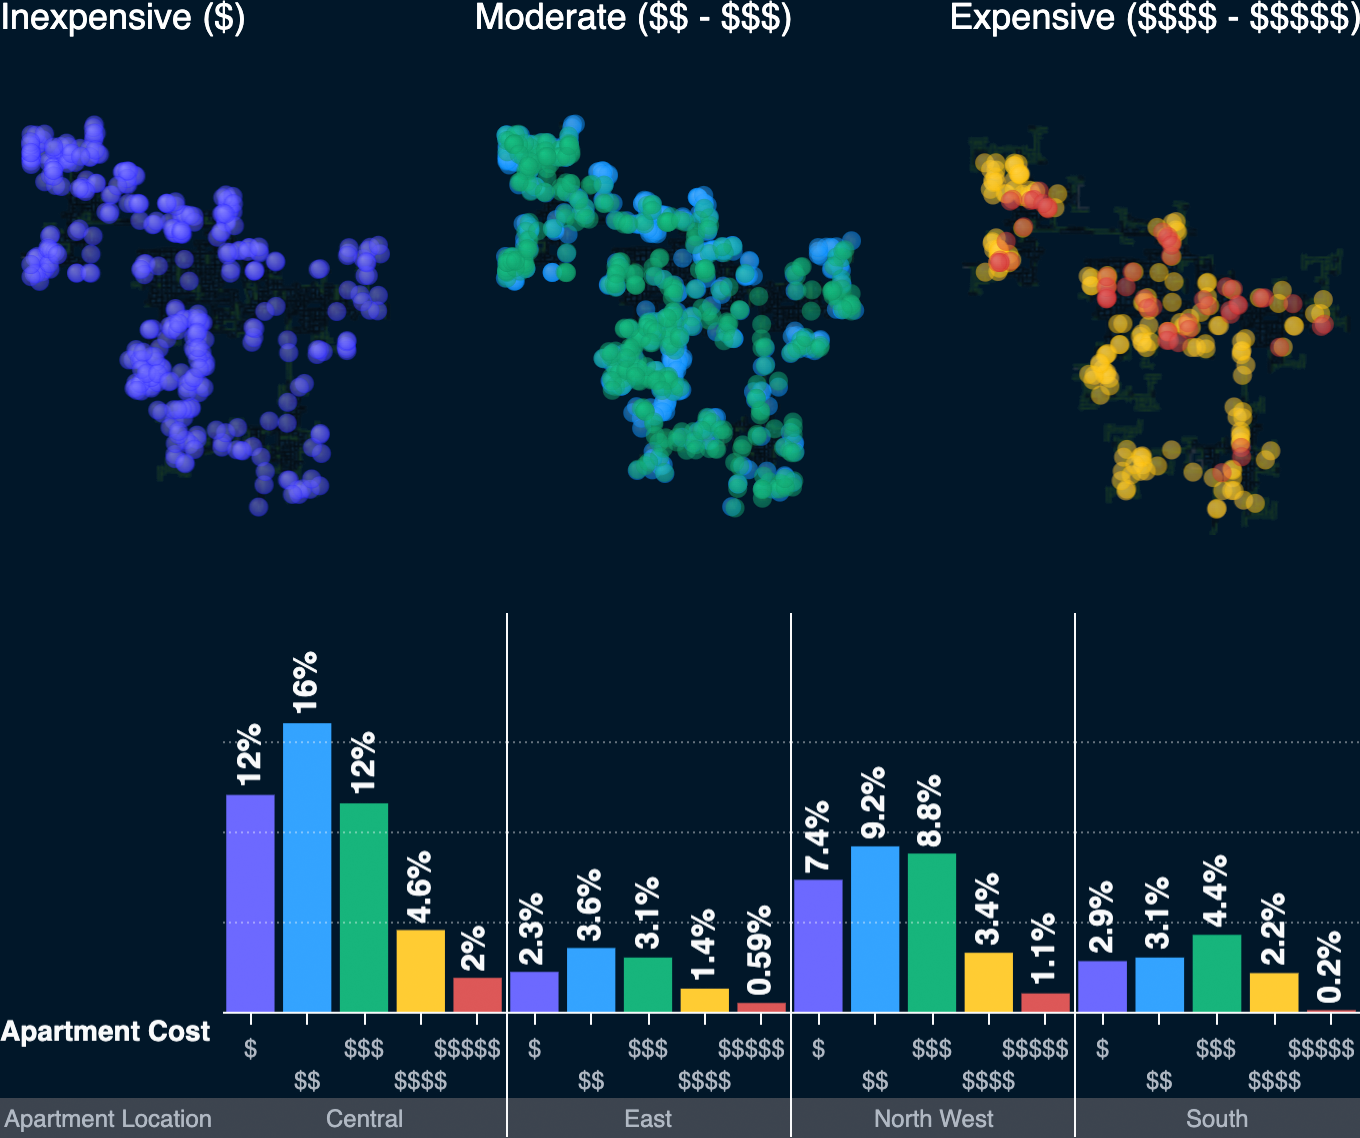
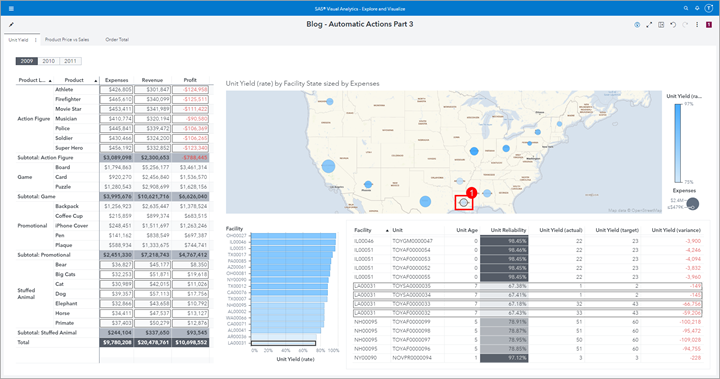
In case you haven’t read about SAS Visual Statistics, let’s start with a quick overview. First, it’s an add-on to SAS Visual Analytics. Second, it’s a web-based solution with an interactive, drag-and-drop interface that helps you rapidly build descriptive and predictive models. Lastly, SAS Visual Analytics and SAS Visual Statistics
Tag: SAS Visual Analytics
Well, this is a kick to the giblets. I assumed when I was summoned to the White House it was in recognition of my tireless advocacy for turkey rights. I wasn’t expecting a press conference in the rose garden or anything, just a meet and greet with the prez and
Today’s healthcare system is under tremendous pressure to reduce overall costs without losing track of the patient. Legislative changes and challenging economic realities make it increasingly difficult to deliver both improved outcomes and cost savings for the most complex patients. The Physicians Pharmacy Alliance (PPA) recognizes the changing healthcare landscape
Greetings, insignificant souls. You may call me … Gregor Castamere. It is not my true name. I stalked this strip of land when it was called New Amsterdam. My family’s name is well known. I have lived for more than 600 years, concealing my terrible secret. I am a vampire.
The weighted average calculation is a useful metric that you should be familiar with. The more common calculation of average is the arithmetic mean, which assumes that each data point has an equal weight. Unlike the arithmetic mean, the weighted average takes into account the fact that some data points
One of the hottest trends today in the business intelligence and analytics spaces is “self-service.” The word self-service is thrown around lightly in many situations and often carries different expectations for different people and organizations. Before we go into the details of self-service analytics it is important to have a
Report design includes several phases. Granted, these phases aren’t official: they’re more a reflection of my own thought processes and how my report designs typically unfold: the initial “get the data on the screen to see what we have” phase the addition of filters and prompts to assist with guided
Great news. If you’ve been struggling to import a Twitter stream as a data source, SAS Visual Analytics 6.4 has greatly simplified that task as part of this release’s expanded data import functionality. The first time you import tweets, you are directed to the Twitter website to log on to
After the 2014 FIFA World Cup, one thing’s clear: here at SAS, we love football (soccer in the US!). To wrap up the popular 2014 World Cup data visualization series on the SAS Visual Analytics Community, we created a presentation that’s chocked-full of interesting insights. From the trillions of pieces
We’re not sure about you, but we just had the most thrilling, suspenseful, and fun month we’ve had in a while. The 2014 FIFA World Cup may be over, but we’re still amazed by not only the game outcomes and level of athleticism, but also by the wealth of interesting
Data visualization tools are a great way to create impactful reports. A well designed report can give users an understanding of their data quickly and easily. And with tools like SAS® Visual Analytics, users can now quickly visualize and understand vast amounts of data. However, with all the visualization options
I’ve recently had the opportunity to learn a little more about administering SAS Visual Analytics. The sessions introduced me to two new GUI interfaces that simplify the work for SAS administrators. In my last post, I shared how to load data into memory using the SAS Visual Data Builder. After
Many years ago I was a SAS administrator for both a UNIX server and a LINUX server. I had a lot of syntax memorized and a lot of commands at my fingertips. If I ever mis-typed a command, I’d have to try again. I remember writing plenty of batch scripts
If there's anyone who represents the global nature of SAS software, it's Falko Schulz. He's a German who lives in Brisbane, Australia while he works for SAS R&D based in Cary, NC. Falko works on the team that produces SAS Visual Analytics, specifically the "explorer" portion of the tool. He
Being so close before Christmas I thought it would be a good idea to see what route Santa Claus is planning this year. Not just because I'm living in Australia and Santa usually comes in t-shirts & shorts but also because it's a long way to get down here. So
If you've heard anything from SAS in recent months, then you've heard about high-performance analytics and the new SAS Visual Analytics offering. SAS has taken the high-performance analytics message around the world in a series of recent "road shows". From the start, this project has enjoyed a different development process
SAS already has some cool mobile Business Intelligence apps. Now, Scott McQuiggan tells Anna Brown, in this Inside SAS Global Forum interview, that you can view the really cool high-performance analytics reports that you've created on your desktop - right from your mobile device. Check this out!!
You saw Justin Choy and Dr. Goodnight demonstrate the amazing capabilities of SAS Visual Analytics on stage during Opening Session and the Technology Connection at SAS Global Forum. I heard a lot of ooohs and ahhhs (Some were from me, I'll admit.). I also had conversations with SAS users later