If you haven't explored data with Automatic Actions enabled yet, then read on to learn about some fast and easy ways to gain insights using One-way filters, Two-way filters or Linked Selection!
Part 1 – Easy exploration for multiple data sources
In this post, we focus on One-way filters.
Here are some benefits of using Automatic Actions: One-way filters and how they behave:
- Applied at the Page level. This means all objects on the page will be filtered if possible.
- Same data source objects are filter automatically, different data source objects require column mappings to be defined under the global Map Data.
- Filters are combined with the AND operator and applied in the order in which they are selected.
We will also cover some Pro Tips for when using Automatic Actions:
- For Control Objects:
- If you want to filter multiple data sources, use the columns from the Global Mapped Data definition for the Role assignment.
- Use the mapped column with the highest cardinality.
- Use the original column in visualizations and not the Custom Category used for mapping data.
- Use Object Titles to label the data source.
Part 2 - Dive into multidimensional or hierarchical data easily
In this post, we cover Automatic Actions: Two-way filters.
The term “two-way” sounds like you get only two opportunities to select a value, but this is not the case. The first value selected will automatically filter all of the objects with either the same data source or mapped data sources on the page. Then, all subsequent value selections will filter all objects on the page including the first source object with an AND condition.
This type of compound filter is especially beneficial for exploring multidimensional or hierarchical data easily. This is because the objects can display different levels of hierarchy and the filtering will simultaneously be applied and you can continue to dive into the hierarchy or dimension.
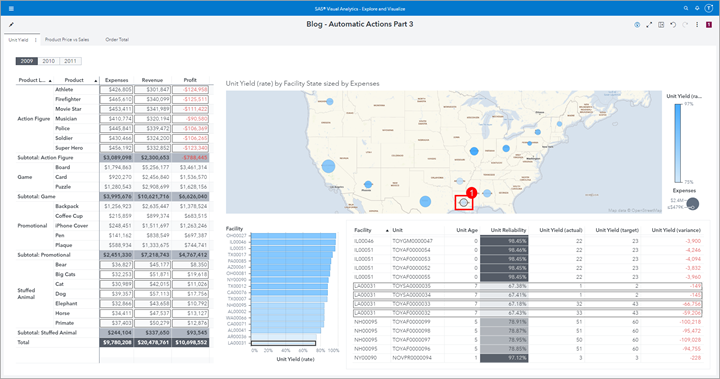
Part 3 - Find related data fast
In part 3 of this series, I cover the Automatic Action: Linked Selection. The Linked Selection Action highlights (or “selects”) the same data simultaneously for all of the objects on the page that support manual linked selections.
The key to using Linked Selection is using related data and data items, but not the exact same Role assignments. Let SAS Visual Analytics do all the work to simultaneously highlight the selected data points. It’s important for report viewers to understand that the selected/highlighted data may represent the entire value or part of the value of the selected row, cell, data point, bubble, tile, etc.
Here are some of the key tips I cover for Linked Selections:
- Automatic Actions are applied at the Page level in the report.
- All objects which support actions will be automatically included in the selected Automatic Action.
- Map Data for different data sources. Include all of the columns you want to be linked.
- Create Custom Categories to assist with Mapping Data for different data sources.
- Hold the Ctrl key to select multiple values.
- Use color meaningfully. Since objects are not filtered but values are selected/highlighted it is important to coordinate colors for data values with purpose.
Demonstration
Watch this video tutorial where I walk through examples of each Automatic Action type.
Thank you for reading! Please check out more of my Communities posts here.
