First introduced in SAS Visual Analytics 8.3, common filters are filters that can be shared between objects in your reports.
Common filter benefits include:
- Easy to assign the same filter conditions to other report objects.
- When you edit a common filter, it is updated everywhere that the common filter is used.
- A common filter is available for the entire report, across pages.
Common filter limitations include:
- Objects must share the same data source as the common filter definition.
- Common filters are not available across multiple reports.
While the benefits speak for themselves, common filters also expedite designing reports and exploring data by quickly reusing the same filter conditions with only a few mouse clicks. To see some examples of this, please watch this YouTube video:
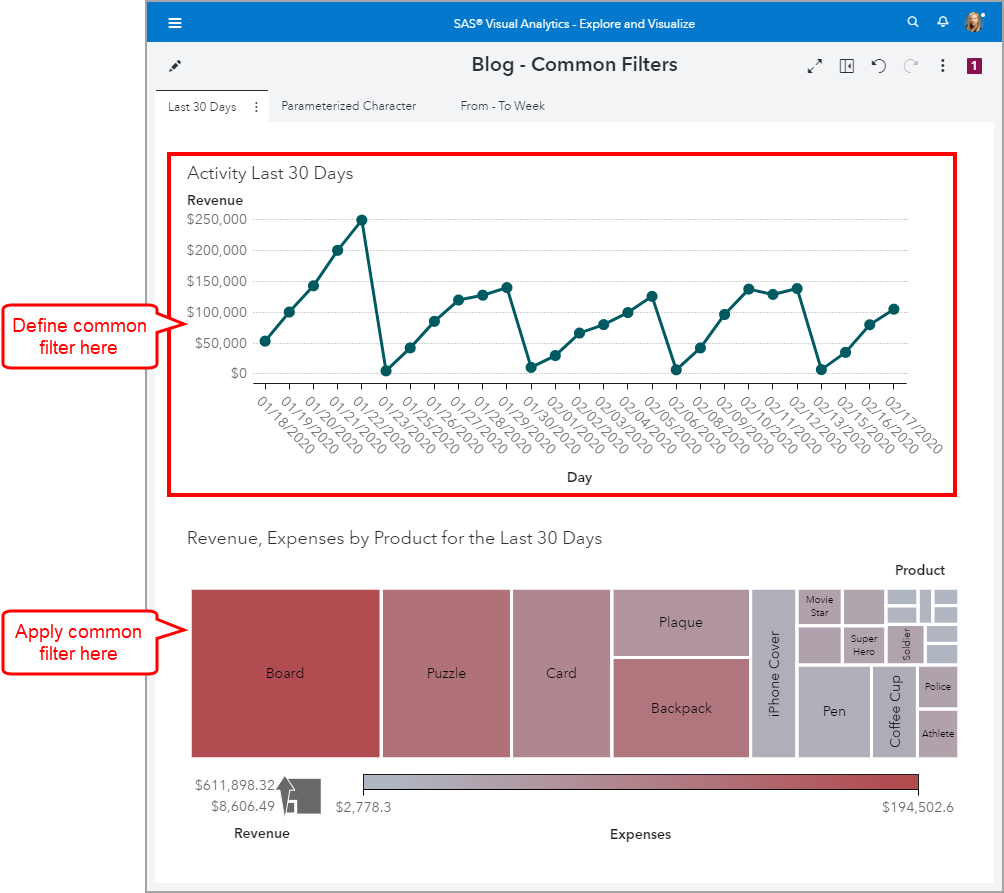
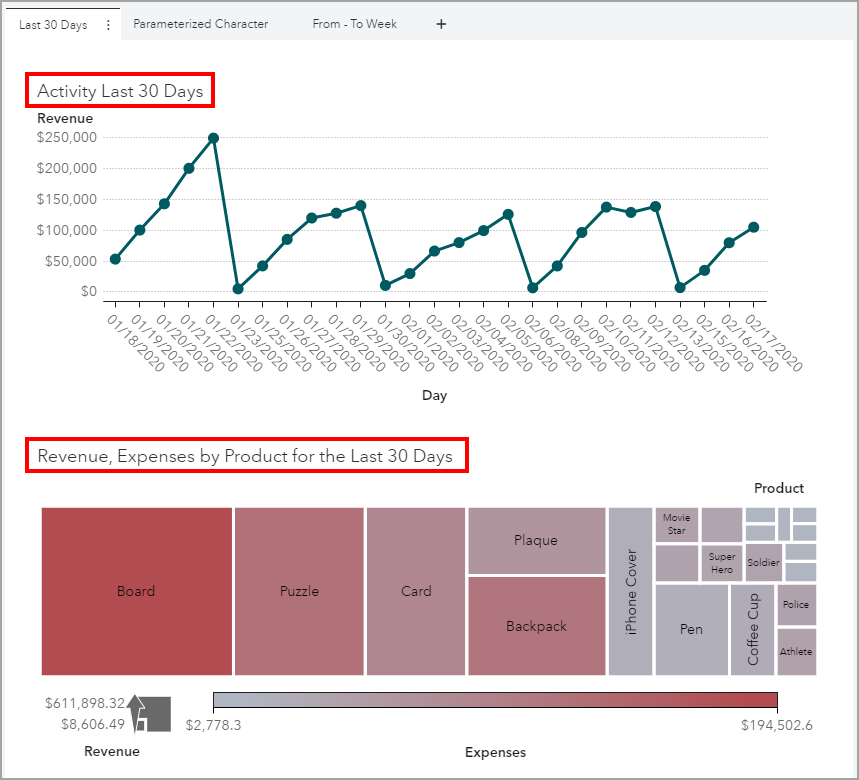
Let’s look at some examples of using common filters. In the screenshot below, I defined a filter to return data for the last 30 days. I converted that filter to a common filter and now the Last 30 Days common filter can be applied to any object in this report that uses the same data source. Then I applied it to the bottom treemap object.
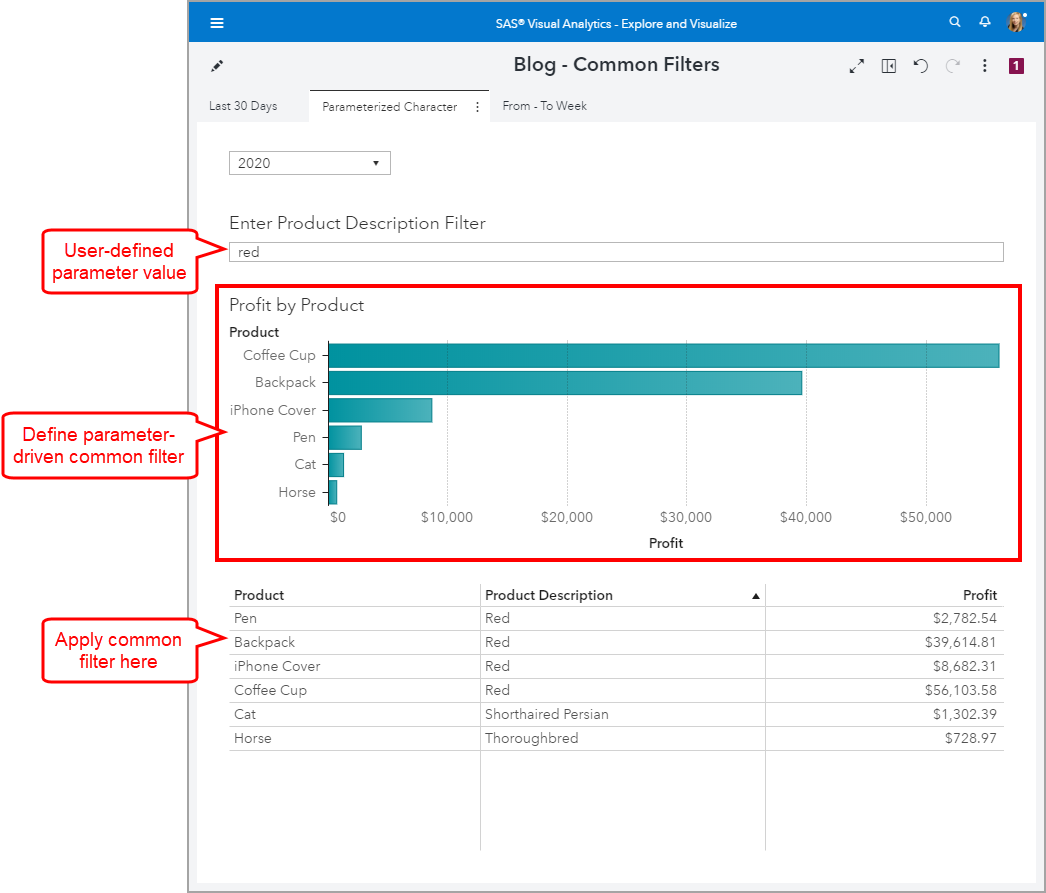
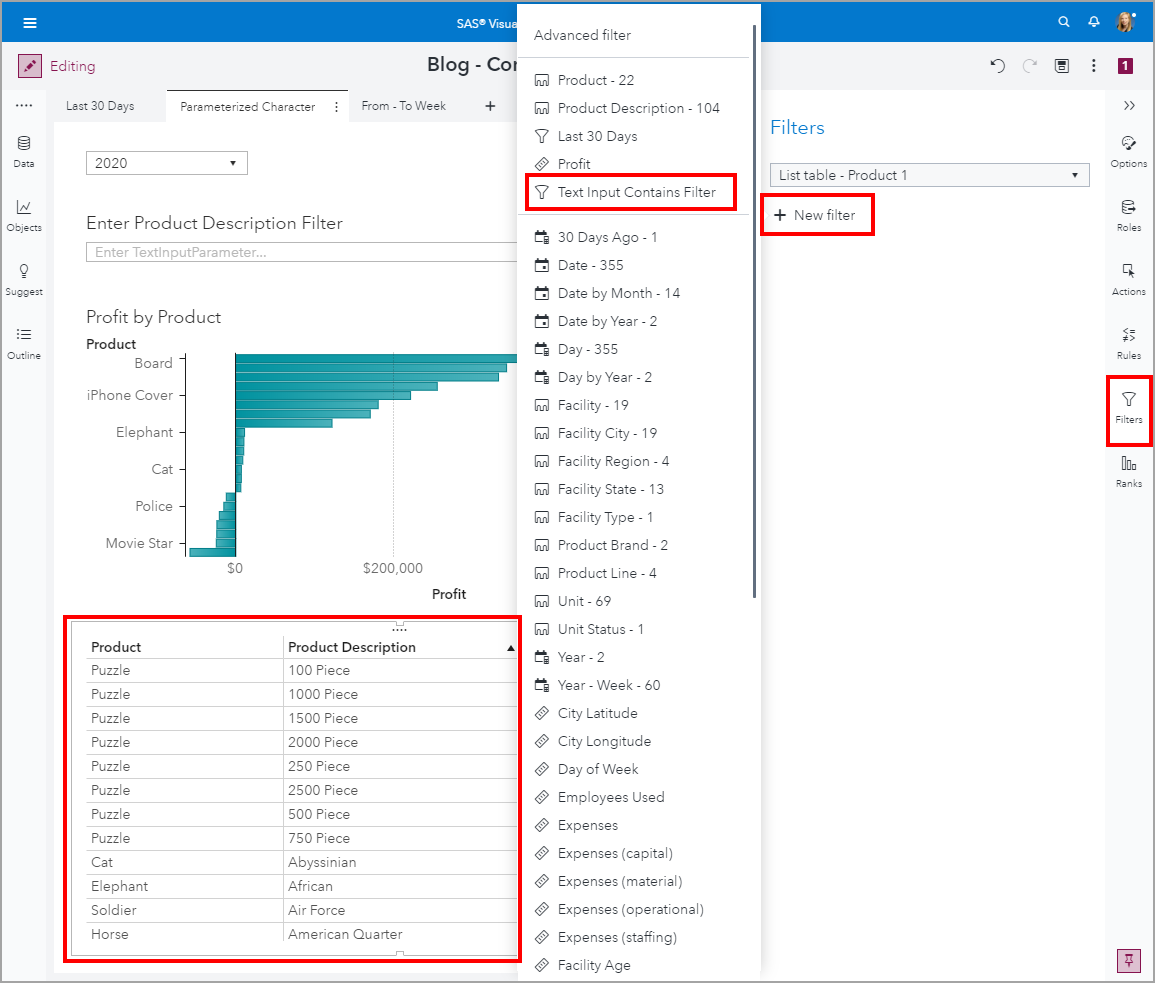
In my second example, I parameterized a text input control to capture a user-defined value. Then I defined a parameter-driven filter for the bar chart object. Next, I converted that filter to a common filter named Text Input Contains Filter and applied it to the list table object below.
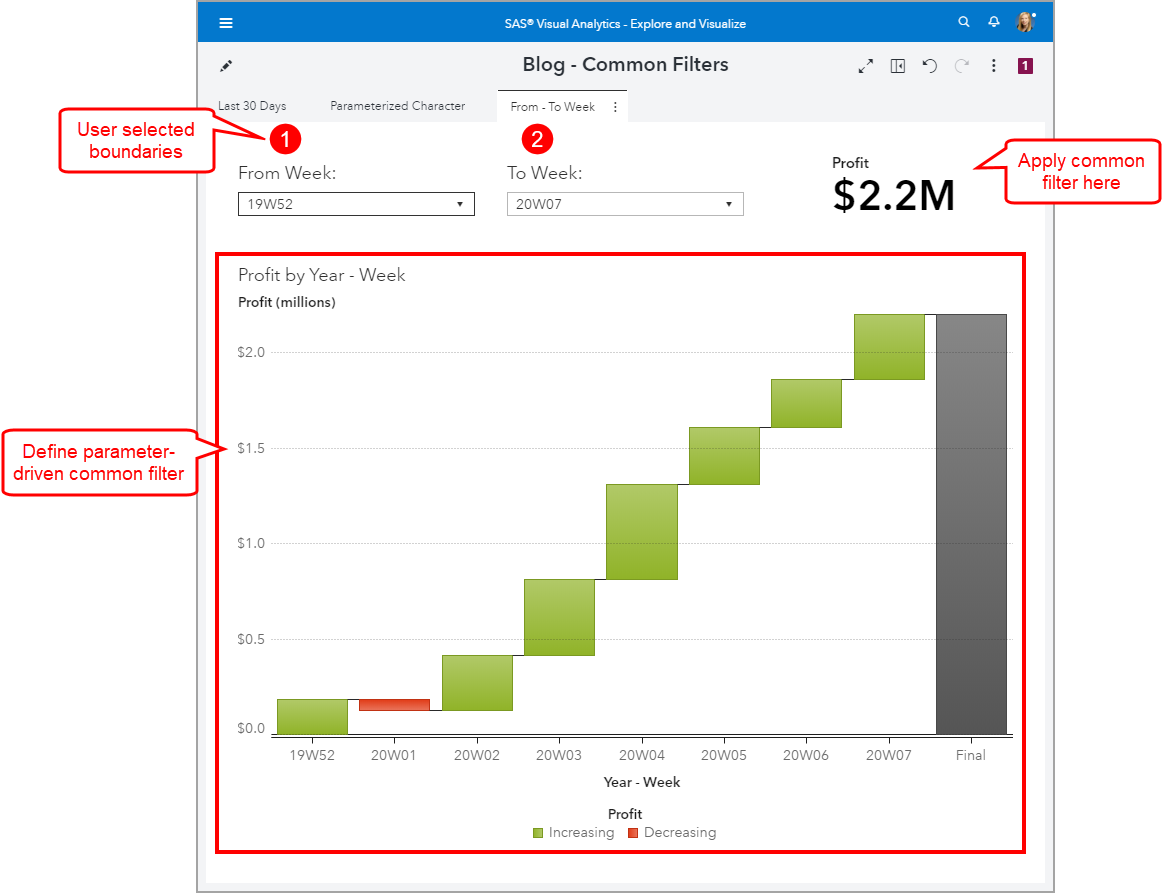
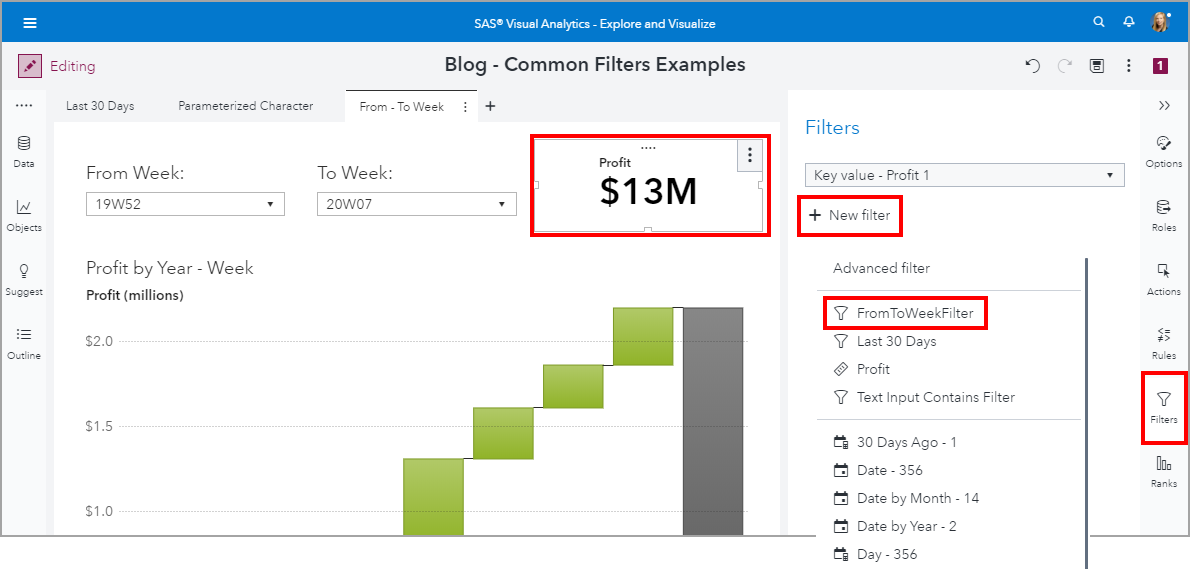
In my third example, I parameterized two drop-down list controls to capture date boundaries. Then I defined a parameter-driven filter for the waterfall chart object. Next, I converted that filter to a common filter named FromToWeekFilter and applied it to the key value object.
Pro tip: Embrace meaningful filter names. Recall that these common filters are associated with the data source for which they are defined. Being able to quickly identify a common filter definition by its name will save you additional mouse clicks in the long run.
Example 1: Last 30 Days Filter
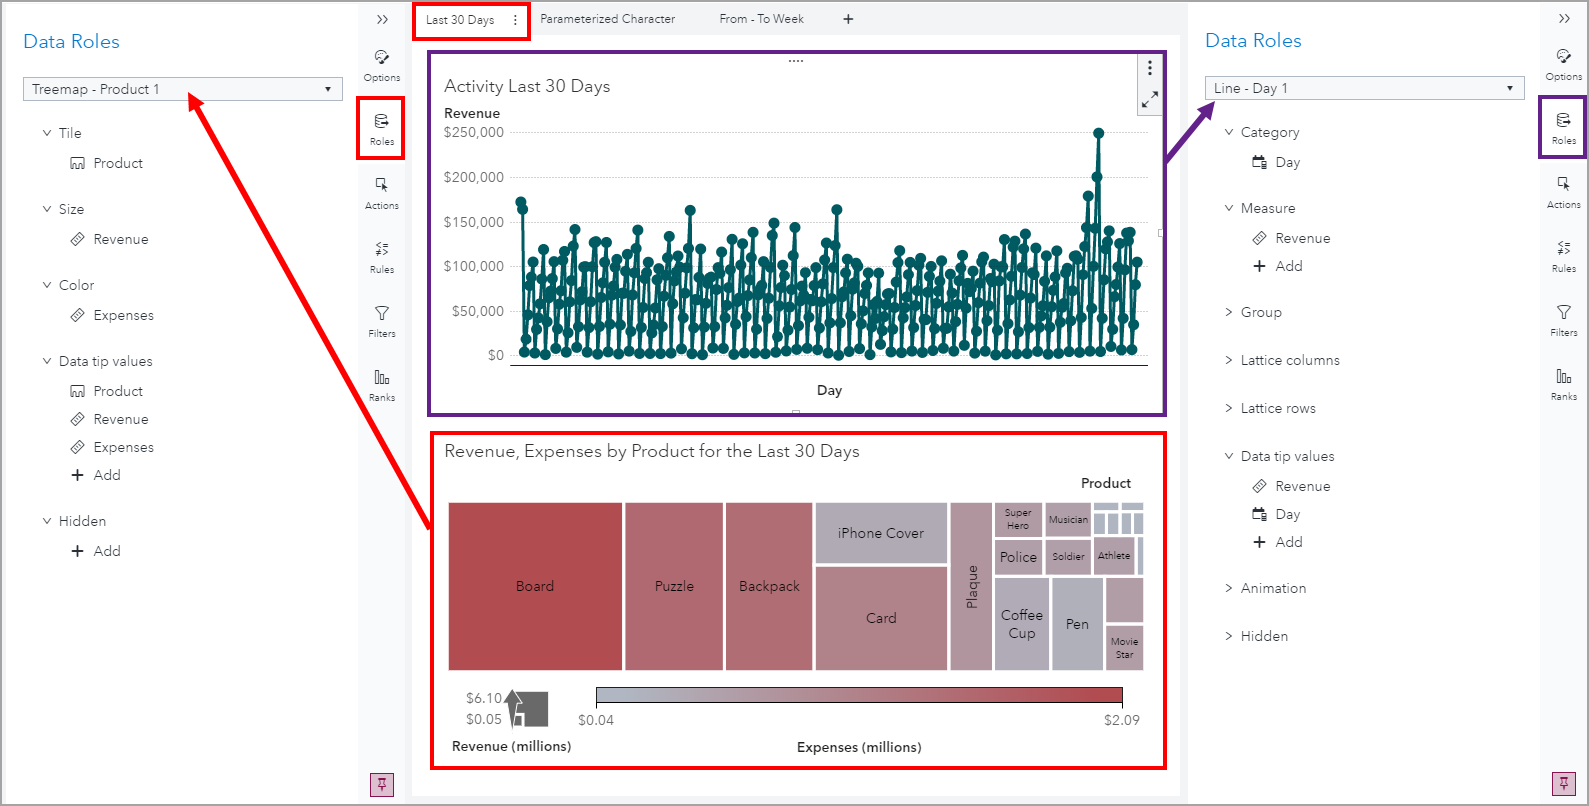
Let’s pick up where we need to define the filters. Therefore, both objects have been added to the report page with roles assigned.
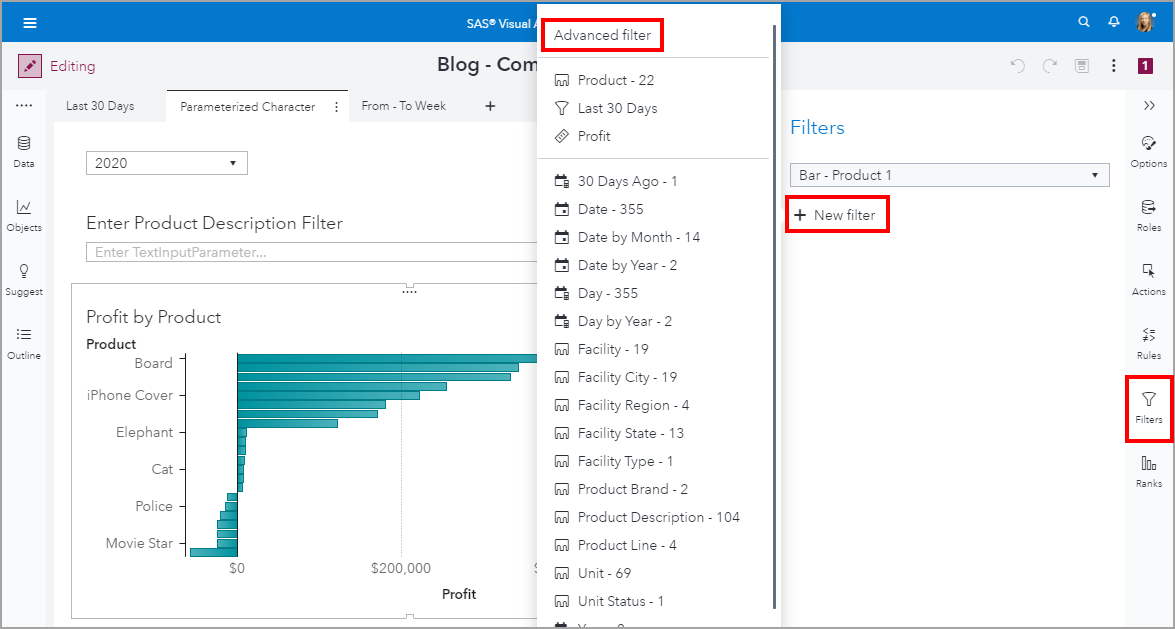
Next, select the line chart object and open the Filters pane. Click + New filter then select Advanced filter.
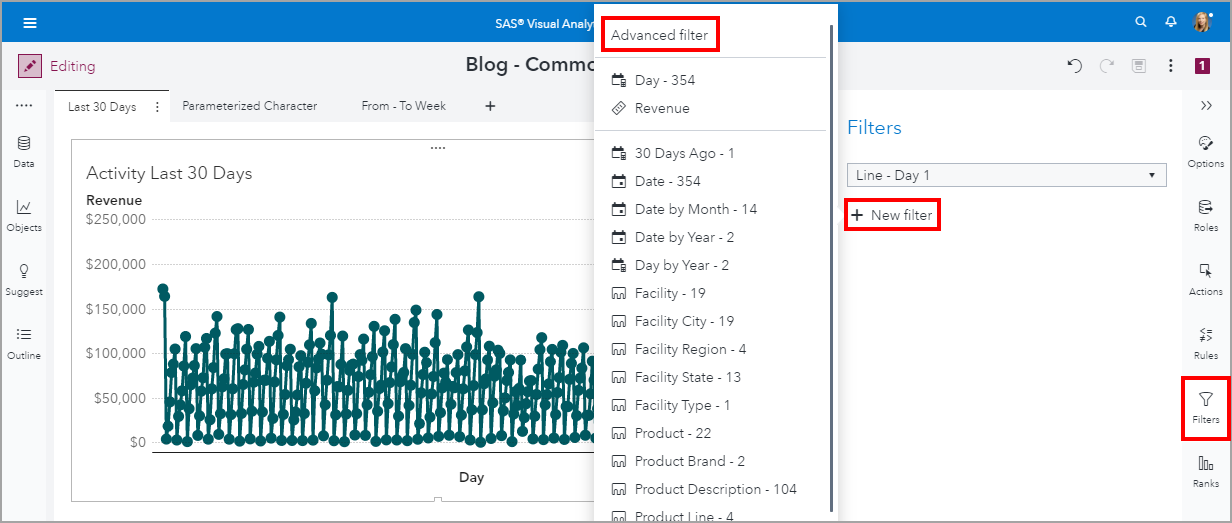
Now we will use the built-in filter conditions offered in SAS Visual Analytics. First, select the date/datetime data item, Day. Second, scroll down in the available conditions until you see Last 30 days, then double click on the condition to add it to the expression editor. Third, give the filter condition a meaningful name and as a final step, be sure the number of returned observations is expected. Click OK.

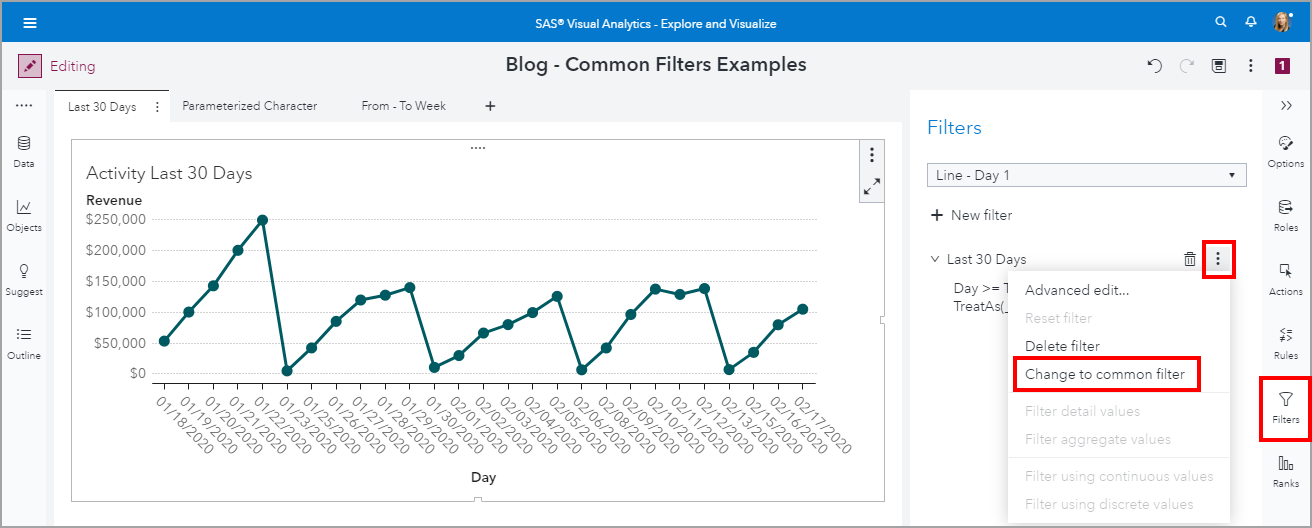
Now we need to convert this filter to a common filter. With the line chart object still selected, on the Filters pane, use the Last 30 Day overflow menu and select Change to common filter.
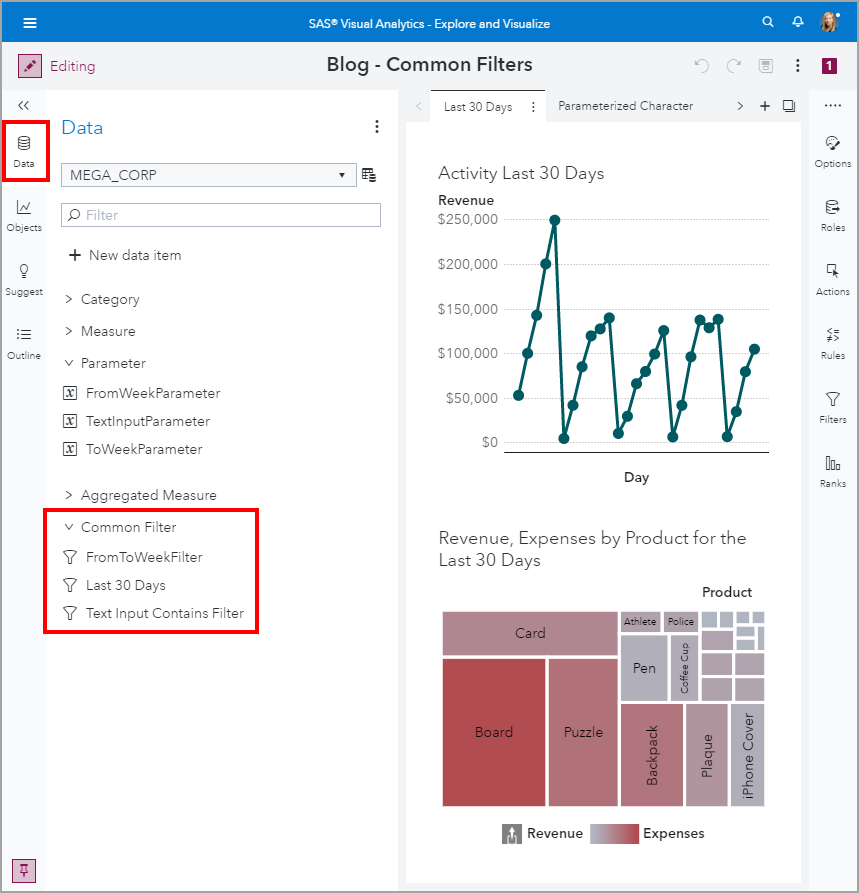
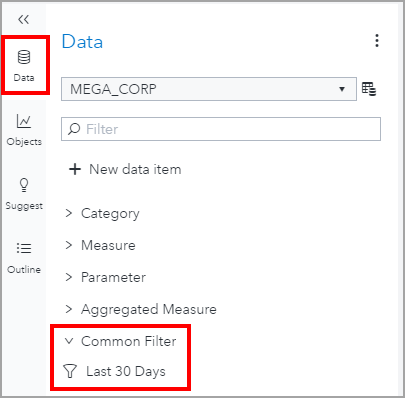
You should now see the Last 30 Days listed as a Common Filter in the Data pane.
Lastly, we can apply this common filter to the treemap object. Select the treemap object, then open the Filters pane. Next click + New Filter and select the common filter Last 30 Days.

It’s good practice to title your objects to reflect any filters that may be defined for them. Especially if there are no prompts, i.e. control objects, driving the subset of data. This is so your report consumers quickly understand that they are only seeing, in this case, the last 30 days of data.
Example 2: Text Input Contains Filter
This next example will define a parameter-driven common filter. If you are not familiar with using parameters in SAS Visual Analytics, start with this article and refer to the additional materials at the end.
See the screenshot below for more information on the data item role assignments for each object. The most important role that will drive the parameter-driven common filter is the parameter. The parameter, TextInputParameter, is a character parameter assigned to the text input control object and it is the only role assignment. If there is nothing entered in this prompt, i.e. control object, then the filter will return all of the data. We will define a contains expression to only return data rows that contain the entered text.

With the bar chart object selected, open the Filters pane and click + New filter and select Advanced filter.
Now we need to build our parameter-driven filter expression. In this filter we will be checking if the Product Description data item Contains the entered text stored in the TextInputParameter. I wrapped each string expression in an UpCase function so that mixed case is ignored. I could have just as easily used the LowerCase function to get the same result.
And finally, remember to give your filter a meaningful name. The returned observations number is not reflective of an applied filter since I do not have any text entered in the control object. If you had text entered there, then your returned observation number may show a subset of matched rows.

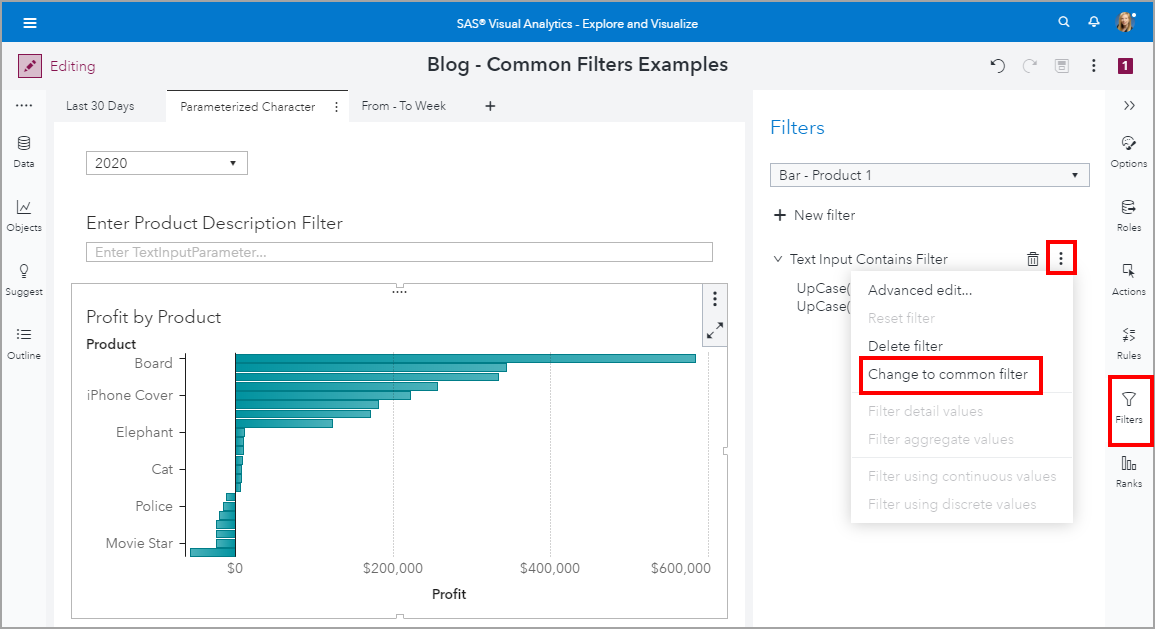
Now we need to convert this object-level filter to a common filter. With the bar chart still the active object, open the Filters pane and use the Text Input Contains Filter overflow menu and select Change to common filter.
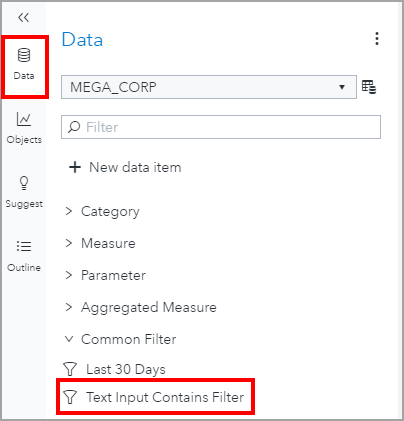
You should now see the Text Input Contains Filter in the Data pane.
To add this common filter to the lower list table object, select the list table object and open the Filters pane. Click on the + New filter and select the Text Input Contains Filter.
Now let’s test the filter. In the screenshot below, I’ve typed the word red. Recall that our filter expression is to return rows where Product Description contains the entered text. Notice that even though I do not have the data item Product Description assigned as a data role in the bar chart object, SAS Visual Analytics is still able to apply the filter appropriately. The list table object does have a role assigned for Product Description so that filter application is easier to identify.

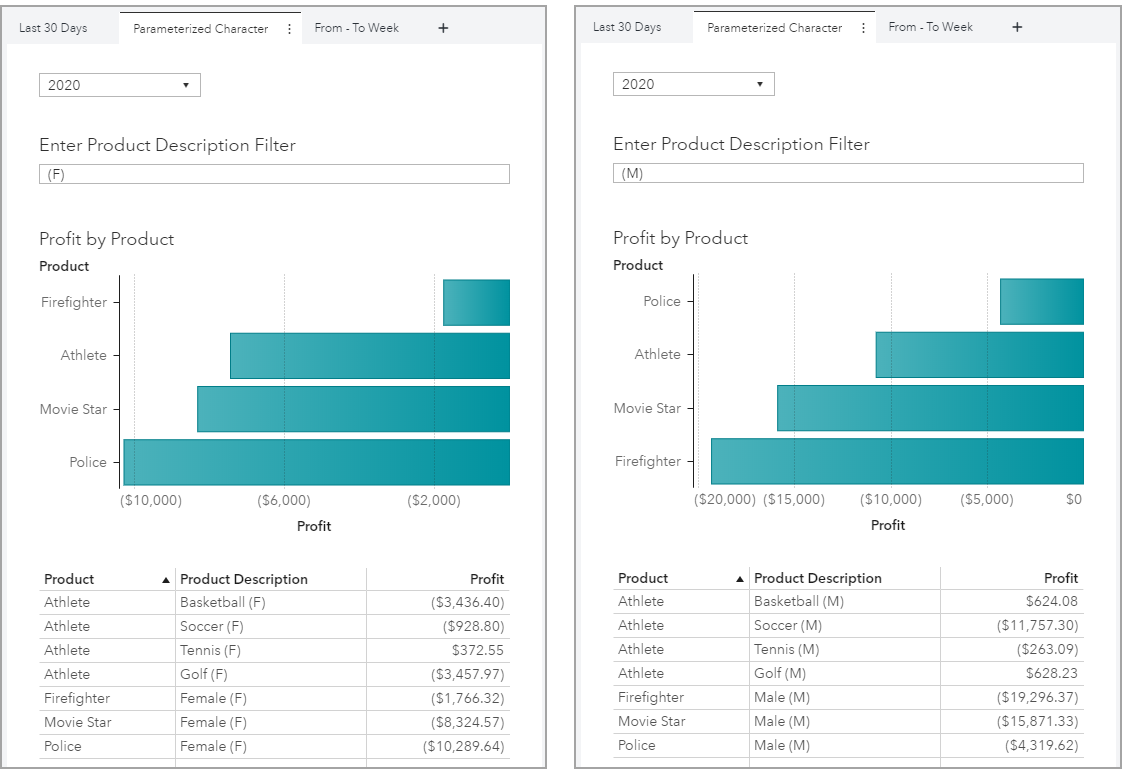
I used the contains operator instead of the equals to return a partial match to the Product Description to help identify trends across multiple Products. In these next examples, I entered the text (F) and (M) to return the rows where the Product Description indicates gender-specific products.
Example 3: From – To Week Filter
This last example will also define a parameter-driven common filter. If you need a more step-by-step guide to similar examples, refer to this YouTube video tutorial:
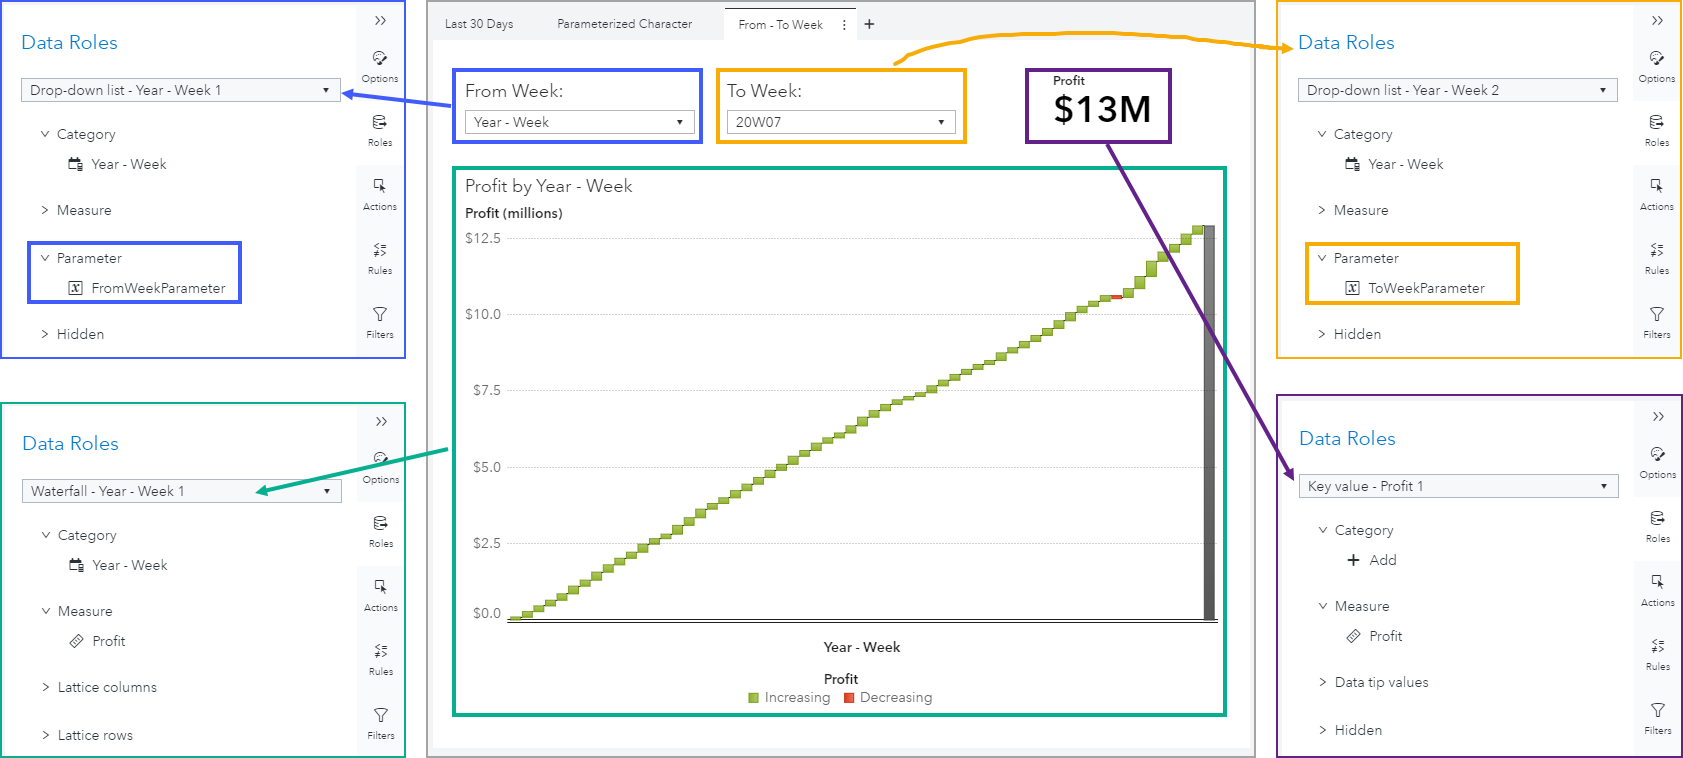
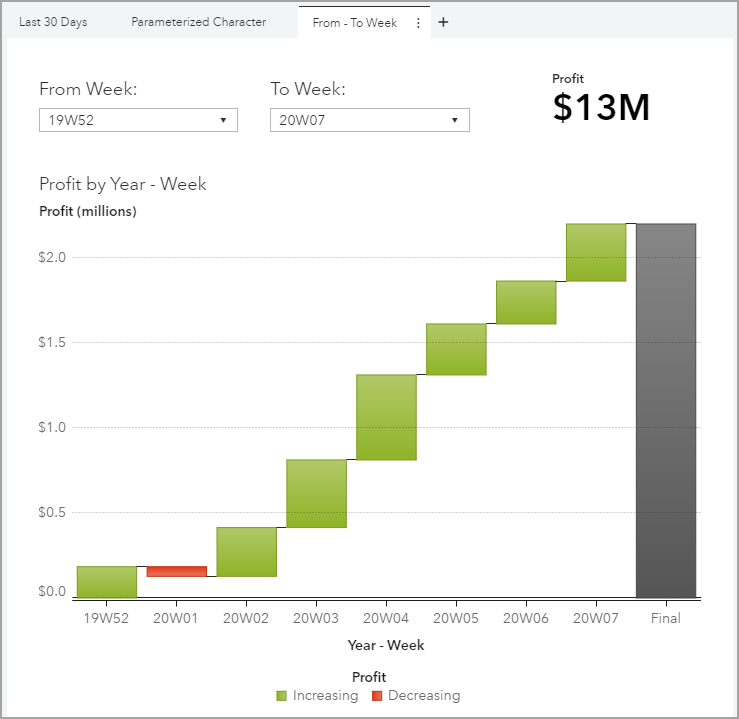
See the screenshot below for more information on the data item role assignments for each object. This example differs from the last in that these control objects, the drop-down lists, use both Category and Parameter Role assignments. The Year-Week data item will provide the available values and the selections will be stored in the parameters FromWeekParameter and ToWeekParameter. I will then create a common filter for an inclusive between of the selected year week values to apply to both the key value object and the waterfall chart.
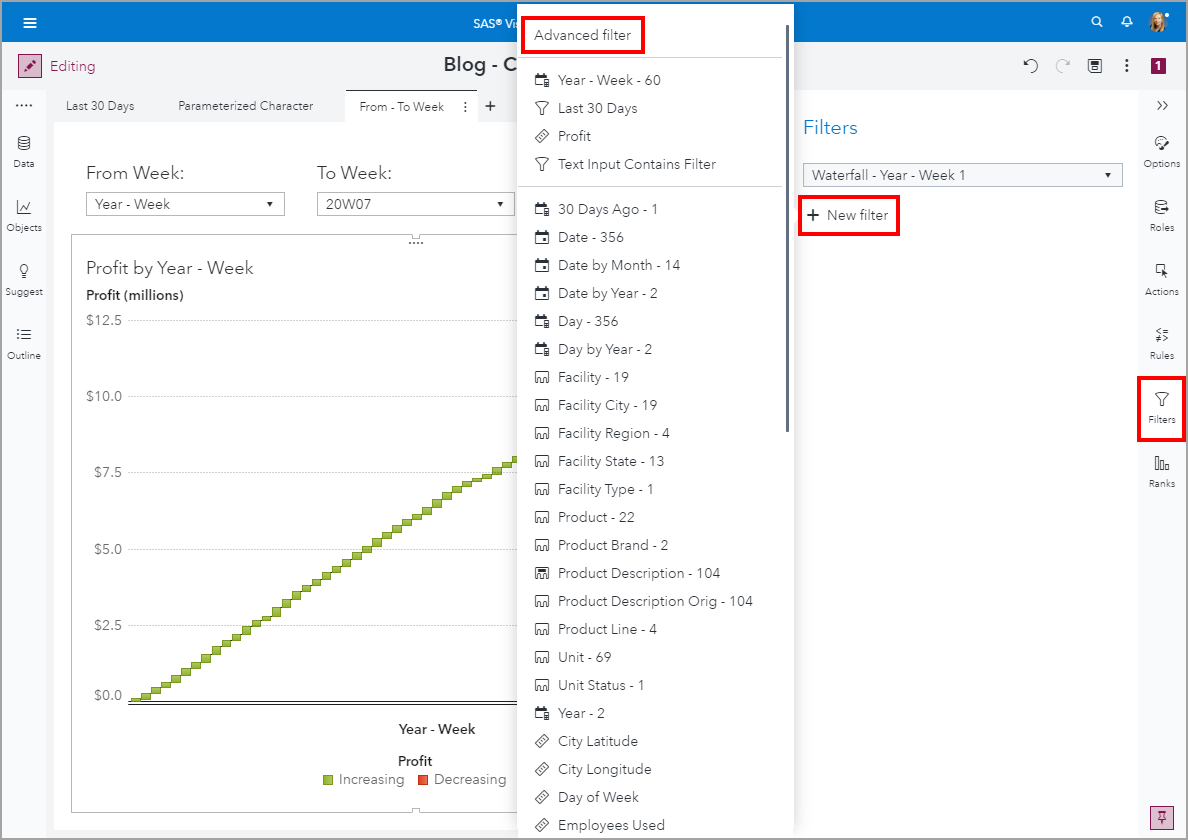
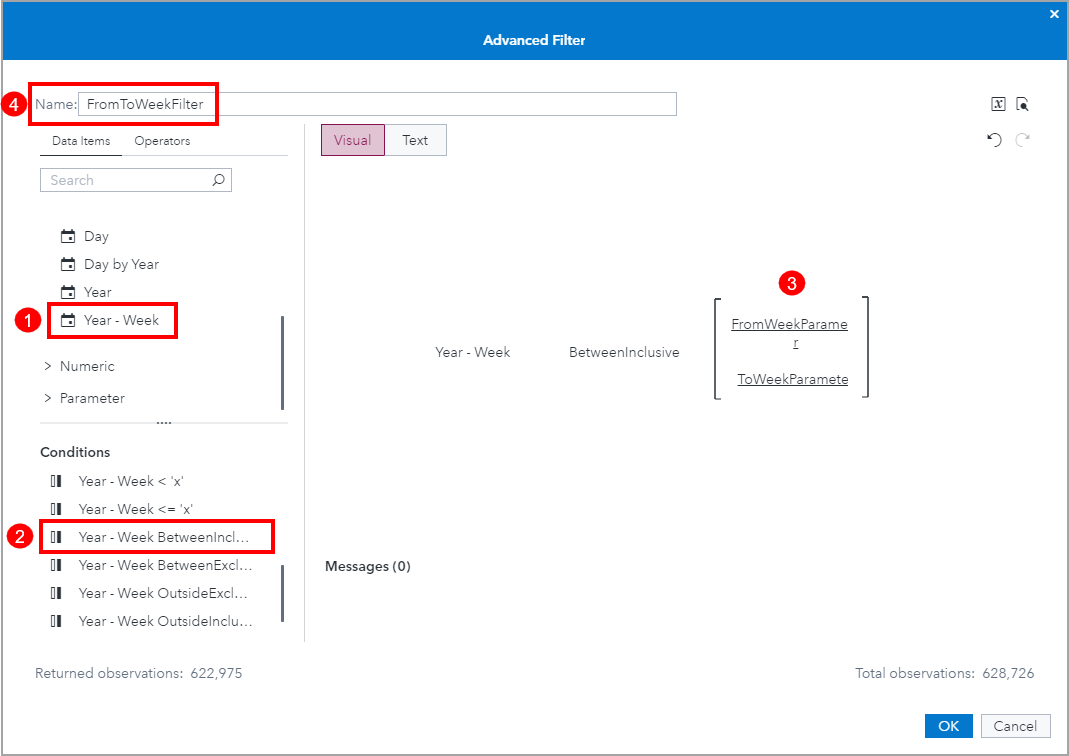
With the waterfall chart object selected, open the Filters pane and click + New filter and select Advanced filter.
Now we need to build our parameter-driven filter expression. In this filter, I will subset the Year-Week date values which are inclusively between the FromWeekParameter and ToWeekParameter boundaries. Follow these steps:
- Select the date/datetime data item, Year-Week.
- Scroll down in the available conditions till you see Year-Week BetweenInclusive(‘x’,’y’), then double click on the condition to add it to the expression editor.
- Drag the FromWeekParameter and ToWeekParameter from the parameter data items list to the expression.
- Give the filter condition a meaningful name. Click OK.
Test the filter by adjusting the values in the drop-down list controls.
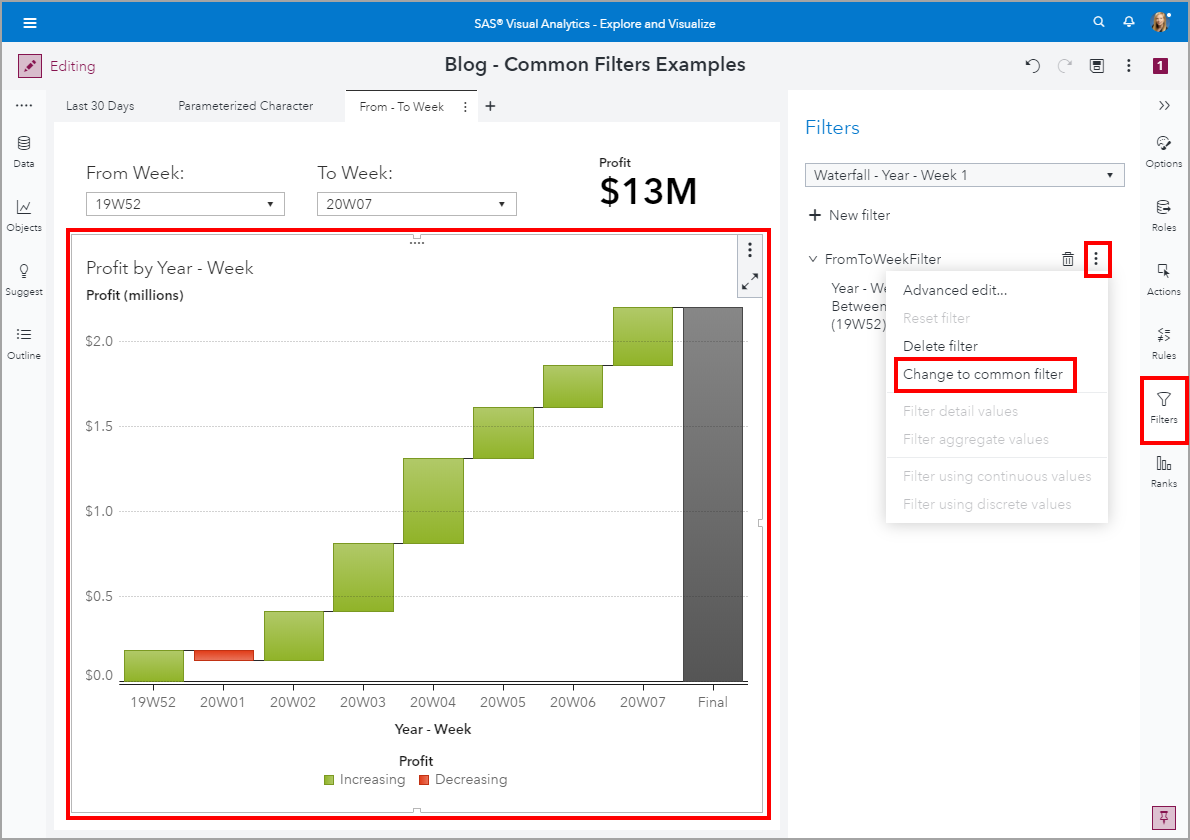
Now we need to convert this object-level filter to a common filter. With the waterfall chart still the active object, open the Filters pane and use the FromToWeekFilter overflow menu and select Change to common filter.
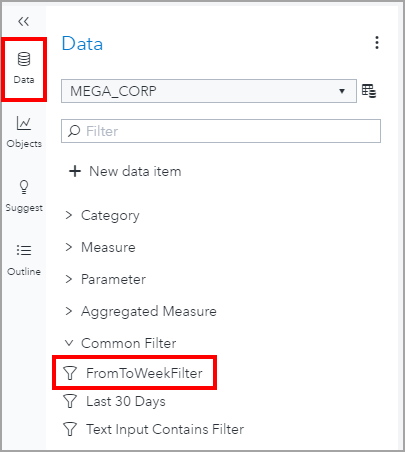
You should now see the FromToWeekFilter in the Data pane.
To add this common filter to the key value object; select the key value object and open the Filters pane. Click on the + New filter and select the FromToWeekFilter.
Conclusion
Remember that once a common filter is defined, it can be used for any object in the report that uses the same data source. In these examples, I applied the common filter on the same report page but you can use a common filter on any page within the report. Recall that all of the common filters are listed and available when I click to apply a new filter to an object.
Hopefully these examples have shown you new ways to explore data faster!
Additional materials for using parameters in SAS Visual Analytics:

2 Comments
Good Morning, Teri.
I really enjoyed reading your SAS tutorial page regarding common filters via SAS Viya. It was quite informative. Being a novice to the SAS Viya environment, I was wondering if you had any advice tips on which resource or reference material which would be great for learning more about building interactive reports in SAS Viya.
Moreover, I have noticed a book on Amazon called, Interactive Reports in SAS® Visual Analytics: Advanced Features and Customization. Let me know if you're familiar with this book and if this resource book would be good for learning the ABCs of interactive report building.
https://www.amazon.com/Interactive-Reports-SAS%C2%AE-Visual-Analytics/dp/1953330533/ref=sr_1_fkmr3_1?crid=397B8JTNM4AGE&keywords=sas+viya+interactive+reports&qid=1683115437&sprefix=sas+viya+interactive+reports%2Caps%2C110&sr=8-1-fkmr3
Thank You
Clarence Jones
clarencej@comcast.net
Hi Clarence,
Thanks so much for your comment.
Yes, that is a good book that covers some of Visual Analytics’ interactive capabilities.
You can also reference this SAS Support page, as there are several good resources on it.
My team also has a YouTube Play list, SAS Technical Insights & Expertise Series. It covers all aspects of Viya, deployment – administration – data management – analytics - visualization – but I cover lots of features to build Visual Analytics reports. Here are a few that you could find helpful:
SAS Demo | Tips for Working With Multiple Data Sources in SAS Visual Analytics
SAS Demo | Use Automatic Actions in SAS Visual Analytics for Fast Data Exploration
SAS Demo | The Power Behind a Hidden Data Role in SAS Visual Analytics
Let me know if you have any specific questions.
Thank you,
Teri