If you don't have a SAS/Graph license, then you're probably using the ODS Graphics 'sg' procedures that come with Base SAS to create your graphs and maps. And if you've tried plotting data on a map, you probably noticed that SGmap lets you overlay point-data on an OpenStreetmap, but you
Tag: sas basics
Free maps to use with SGmap, in Base SAS!
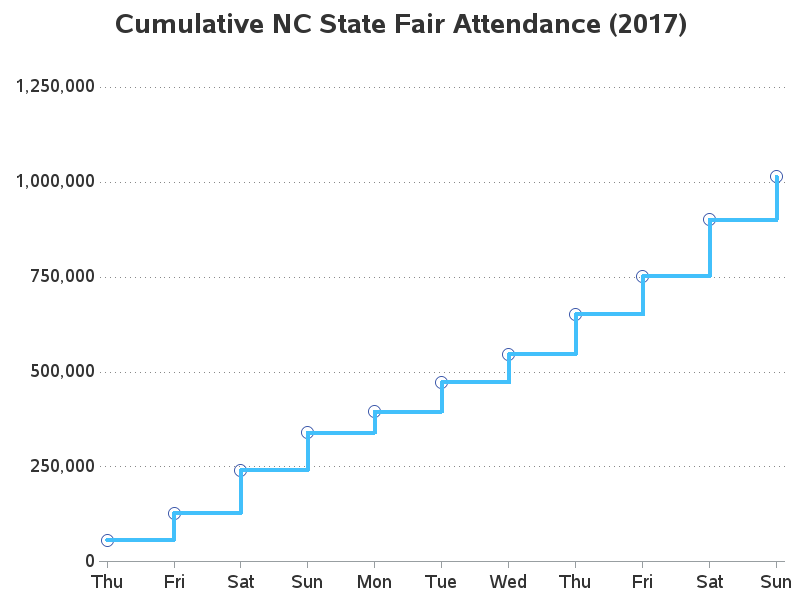
Cumulative values - "We can do this the easy way, or the hard way..."
In many movies, there is often a scene where the star says "We can do this the easy way, or the hard way" (and the hard way usually involves quite a bit of pain). So it is with interrogations ... and so it is with writing SAS code! Today I'm
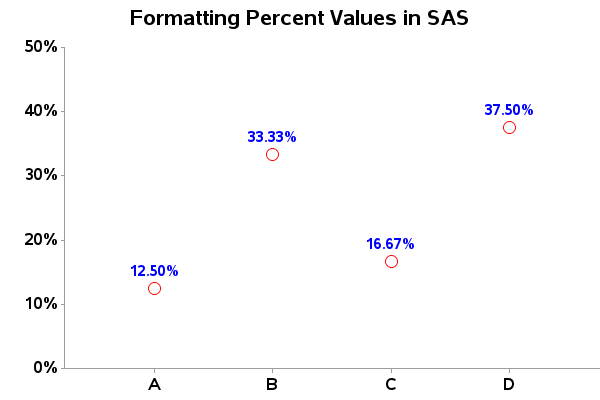
How to handle percent (%) values in SAS
Being that 2013 is the International Year of Statistics, I wanted to make sure everyone knows how to handle my favorite statistic - percent (%) - in SAS! I often see data in spreadsheets/csv/etc that purport to represent "percents"... but you have to be a bit careful when working with