Turnip plot redux
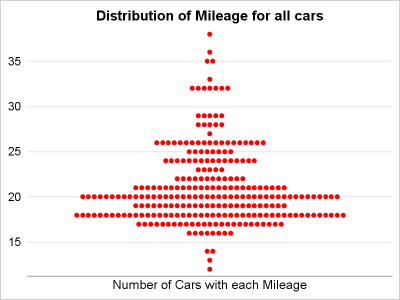
Last year, a user asked about creating a "Turnip Plot" as used in this study of Caesarian Section Rates. Primarily, this is similar to a histogram on the y-axis for each unique value on the y-axis. A marker is drawn for each occurrence, starting from the center. Back then, I

