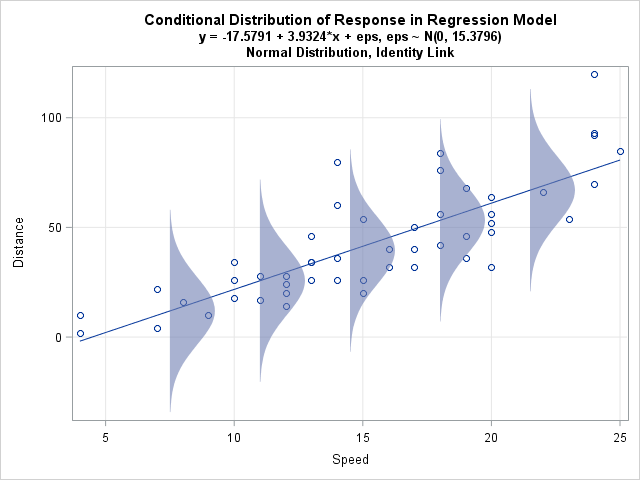
Plot the conditional distribution of the response in a linear regression model

A friend who teaches courses about statistical regression asked me how to create a graph in SAS that illustrates an important concept: the conditional distribution of the response variable. The basic idea is to draw a scatter plot with a regression line, then overlay several probability distributions along the line,