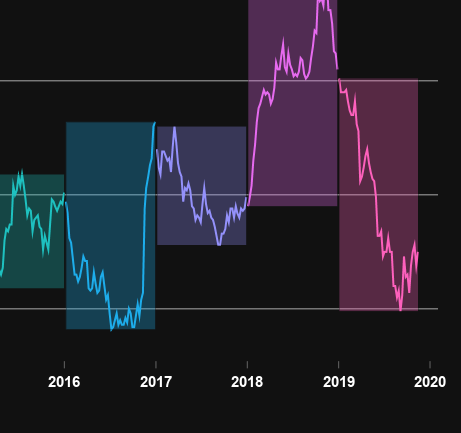
These mortgage rates look shady to me!

The English language can be a bit tough to learn. One reason is that sometimes words can have more than one meaning. For example, the word shady can mean "of doubtful honesty or legality," or it can mean "giving shade from sunlight." Which of those meanings am I thinking about,