Many things in nature can be seen as chain reactions. When one action occurs, others follow suit. For example, atmospheric greenhouse gas levels are increasing, which leads to a warming of the oceans. As the oceans warm, weather and climate patterns across the globe are impacted because the amount of
Tag: oceans
4 ways to visualize climate changes in the oceans and the Arctic
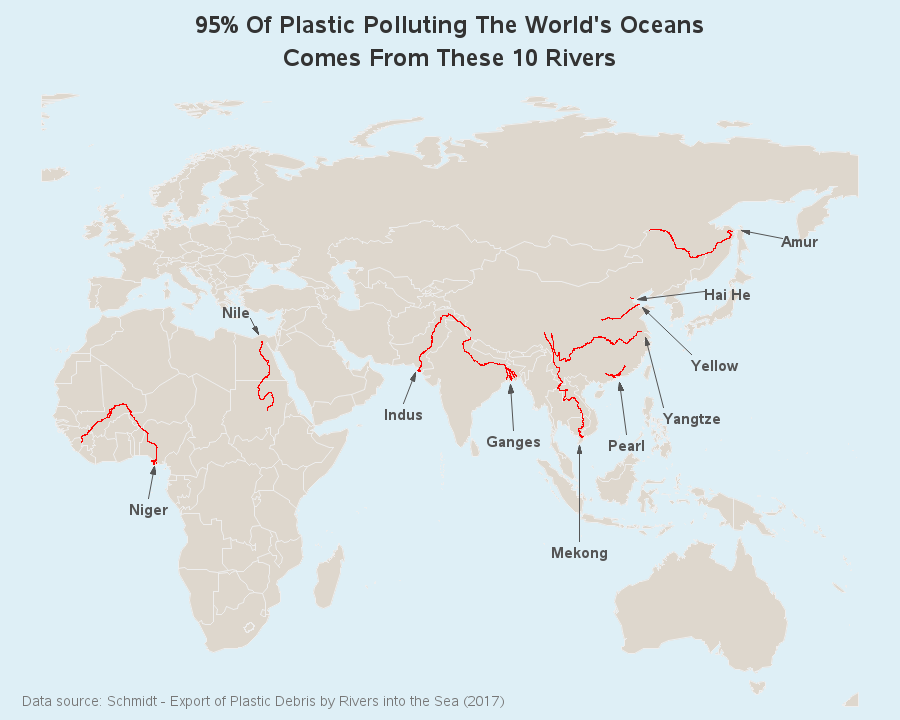
Can you guess which 10 rivers produce 95% of the ocean's plastic pollution?
Plastic pollution in the oceans is becoming a huge problem. And, as with any problem, finding the solution starts with identifying the source of the problem. A recent study estimated that 95% of the plastic pollution in our oceans comes from 10 rivers - let's put some visual analytics to
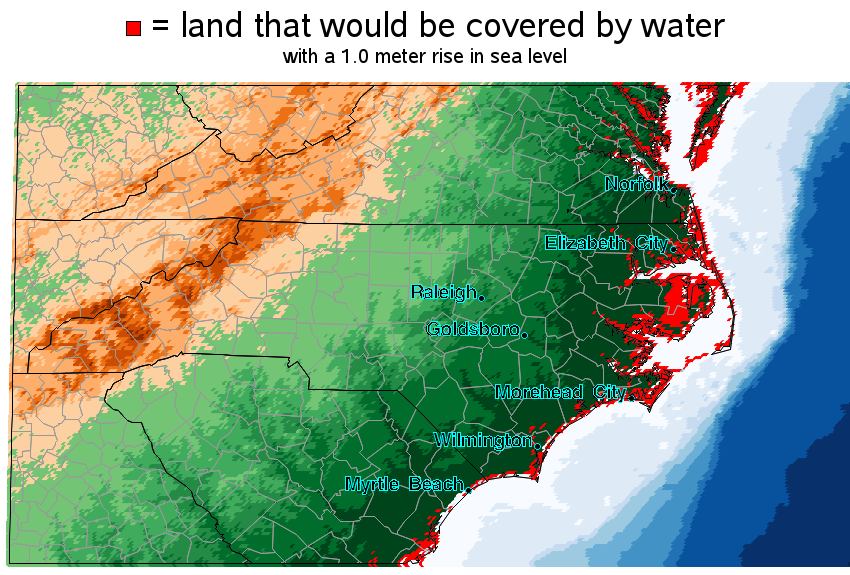
A visual analysis of rising sea levels
In light of the recent reports that glaciers in Antarctica are melting, what SAS graphs might be useful in analyzing the data?... When floating sea ice melts (such as at the North Pole), it doesn't raise the sea level - but when ice on land melts (such as glaciers at