If you don't have a SAS/Graph license, then you're probably using the ODS Graphics 'sg' procedures that come with Base SAS to create your graphs and maps. And if you've tried plotting data on a map, you probably noticed that SGmap lets you overlay point-data on an OpenStreetmap, but you
Tag: mapimport
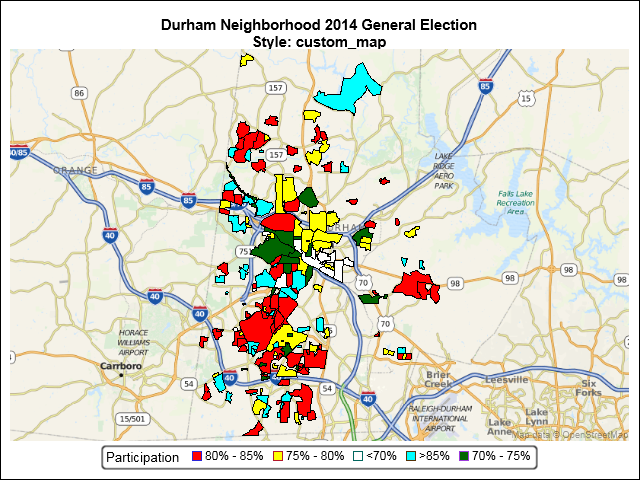
An earlier SGMAP blog used the BUBBLE statement to overlay point data on top of an Open Street Map. However, not all map features are points. Some are enclosed areas called polygons. Some map polygons share common borders such as states and counties. Others are separate, non-contiguous regions such as national parks
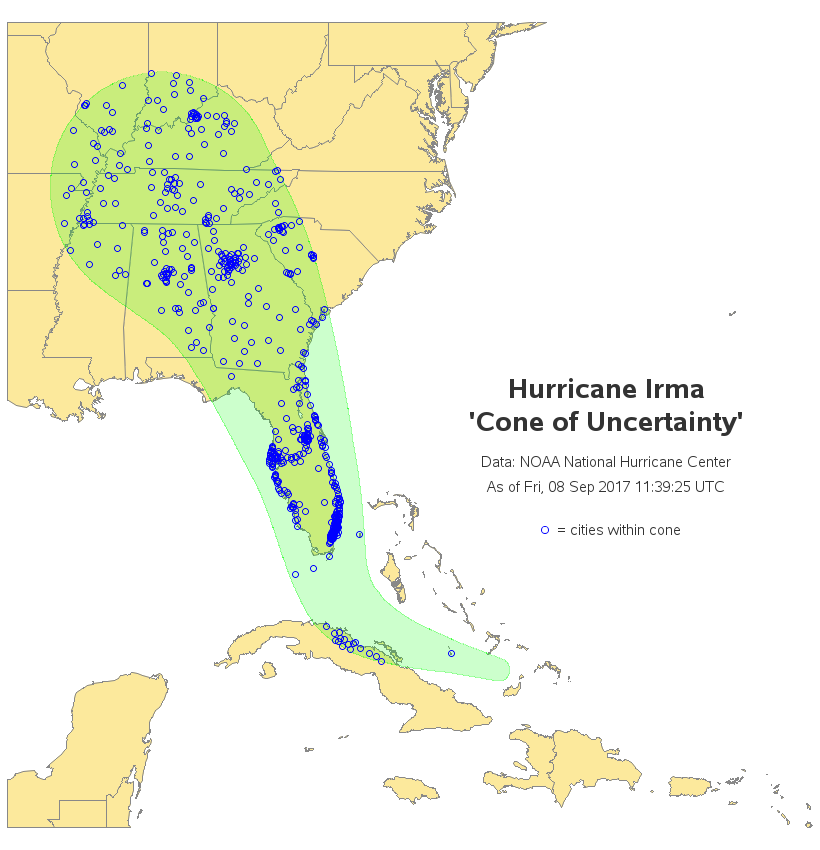
As Hurricane Irma makes its way through the Caribbean, and heads towards the United States, the big question on everyone's mind ... is the hurricane going to hit my city? Or, as some people like to say, "should I buy milk & bread?" Let's analyze & map some data to
There will be a total solar eclipse on August 21, 2017, and the umbra (total shadow) will pass right across the United States! As a data guy, a map guy, and an astronomy fan, this is an opportunity I just couldn't pass up! Follow along as I apply my computer skills
SAS provides a map for each country, but there are likely other maps you want to use that SAS does not provide. If you have other maps in the Esri shapefile format, you're in luck - you can import those maps and use them! In this blog post I share
While talking to SAS users in Australia earlier this month, I often demonstrated the capabilities of the new Map Chart task in SAS Enterprise Guide 4.3. Creating map charts has never been easier: select your map data source, then select your response data source, and click Run. Voila! You've got