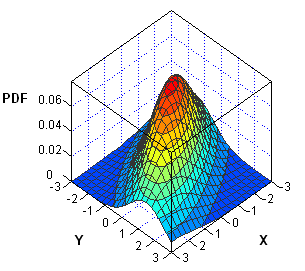
Visualize the bivariate normal cumulative distribution

When you are working with probability distributions (normal, Poisson, exponential, and so forth), there are four essential functions that a statistical programmer needs. As I've written before, for common univariate distributions, SAS provides the following functions: the PDF function, which returns the probability density at a given point the CDF