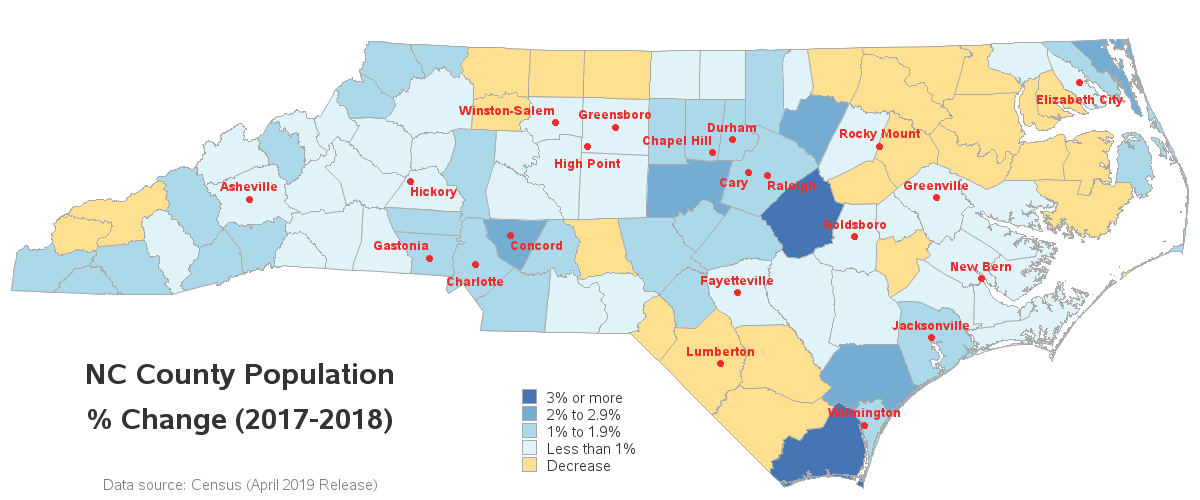
I've heard many customers ask "Can SAS do/use/handle census block maps?" My answer was "of course!" ... but I never really had any examples to show/prove that. Well, now I do! :) First, you need to locate & download the shape files for the census blocks you're interested in plotting. For
Tag: gmap
Census block maps in SAS
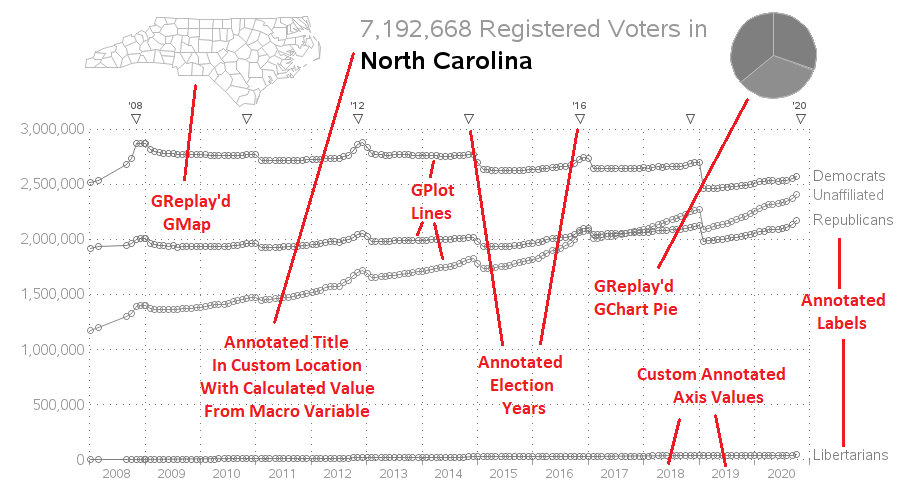
Adding pop-up graphs to your SAS/GRAPHs
By now, most of you probably already know how to add drill downs and hover text to your SAS graphs. But did you know you can add pop-up images and graphs? Here are a couple of examples ... In this first example, when you hover your mouse over each state, you
Using 3rd party shape files to build map charts in SAS
While talking to SAS users in Australia earlier this month, I often demonstrated the capabilities of the new Map Chart task in SAS Enterprise Guide 4.3. Creating map charts has never been easier: select your map data source, then select your response data source, and click Run. Voila! You've got