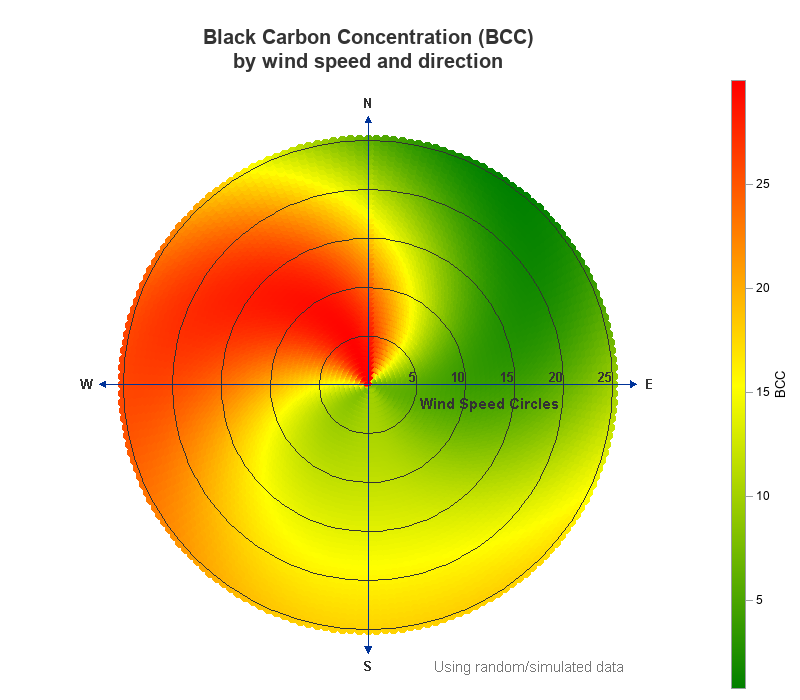
A few years ago Sanjay showed how to create a polar graph by creating a gtl template, and then plotting it using Proc SGRender. These days, Proc SGPlot has all the functionality you need to create this graph, therefore I've rewritten the example to just use SGPlot. And while I
Tag: EllipseParm
Polar graph remix - using sgplot (no gtl/sgrender!)
Polar Graph
There are many situations where it is beneficial to display the data using a polar graph. Often your data may contain directional information. Or, the data may be cyclic in nature, with information over time by weeks, or years. The simple solution is to display the directional or time data
Proportional Euler Diagram
The topic of VENN diagrams had come up a while ago. At that time, I thought it may be interesting to build a proportional VENN diagram. But, reading up on VENN Diagrams, I learned that VENN diagrams represent all intersections of N sets, regardless of whether there are actually any observations in one