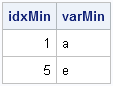
Tag: Data Analysis

Rick Wicklin 0
The Poissonness plot: A goodness-of-fit diagnostic

Last week I discussed how to fit a Poisson distribution to data. The technique, which involves using the GENMOD procedure, produces a table of some goodness-of-fit statistics, but I find it useful to also produce a graph that indicates the goodness of fit. For continuous distributions, the quantile-quantile (Q-Q) plot

Rick Wicklin 0
Creating a periodic smoother

In yesterday's post, I discussed a "quick and dirty" method to smooth periodic data. However, after I smoothed the data I remarked that the smoother itself was not exactly periodic. At the end points of the periodic interval, the smoother did not have equal slopes and the method does not

1 139 140 141 142 143 169