Two applications of the "runs test"

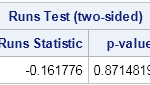
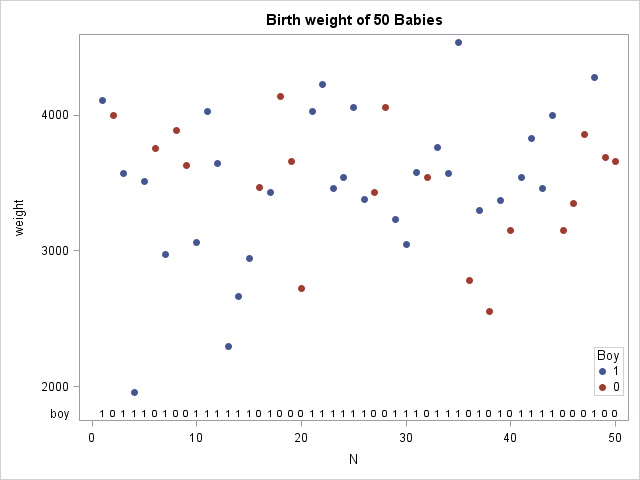
In my last blog post I described how to implement a "runs test" in the SAS/IML language. The runs test determines whether a sequence of two values (for example, heads and tails) is likely to have been generated by random chance. This article describes two applications of the runs test.