Tag: Data Analysis

Rick Wicklin 0
The frequency of bigrams in an English corpus

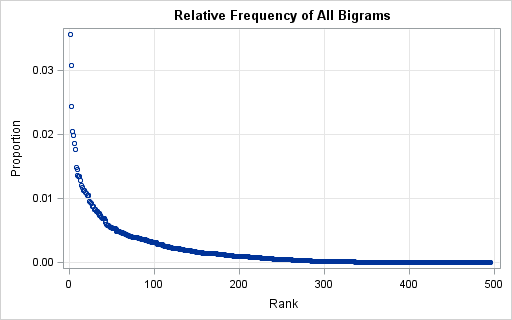
In last week's article about the distribution of letters in an English corpus, I presented research results by Peter Norvig who used Google's digitized library and tabulated the frequency of each letter. Norvig also tabulated the frequency of bigrams, which are pairs of letters that appear consecutively within a word.
Rick Wicklin 0
Designing a quantile bin plot

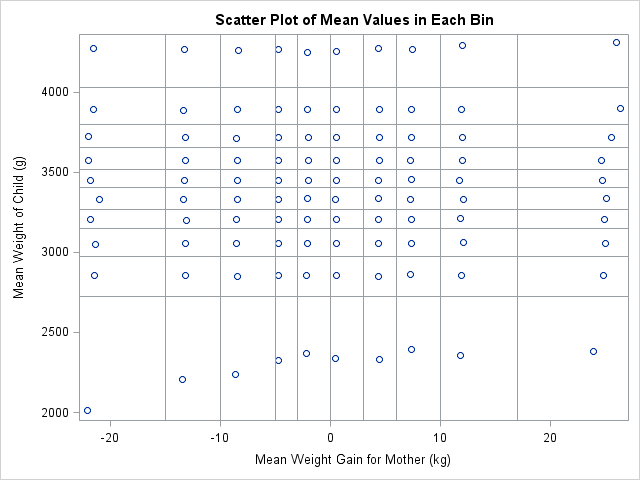
While at JSM 2014 in Boston, a statistician asked me whether it was possible to create a "customized bin plot" in SAS. When I asked for more information, she told me that she has a large data set. She wants to visualize the data, but a scatter plot is not

Rick Wicklin 0
Skew this

The skewness of a distribution indicates whether a distribution is symmetric or not. A distribution that is symmetric about its mean has zero skewness. In contrast, if the right tail of a unimodal distribution has more mass than the left tail, then the distribution is said to be "right skewed"

1 122 123 124 125 126 175