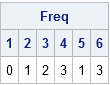
Tag: Data Analysis

Rick Wicklin 0
Correlations between groups of variables

Typically a correlation analysis reports the correlations between all pairs of variables, including the variables with themselves. The resulting correlation matrix is square, symmetric, and has 1s on the main diagonal. But suppose you are interested in only specific combinations of variables. Perhaps you want the pairwise correlations between one

Rick Wicklin 0
Regression coefficient plots in SAS

Last week's post about odds ratio plots in SAS made me think about a similar plot that visualizes the parameter estimates for a regression analysis. The so-called regression coefficient plot is a scatter plot of the estimates for each effect in the model, with lines that indicate the width of

1 107 108 109 110 111 169