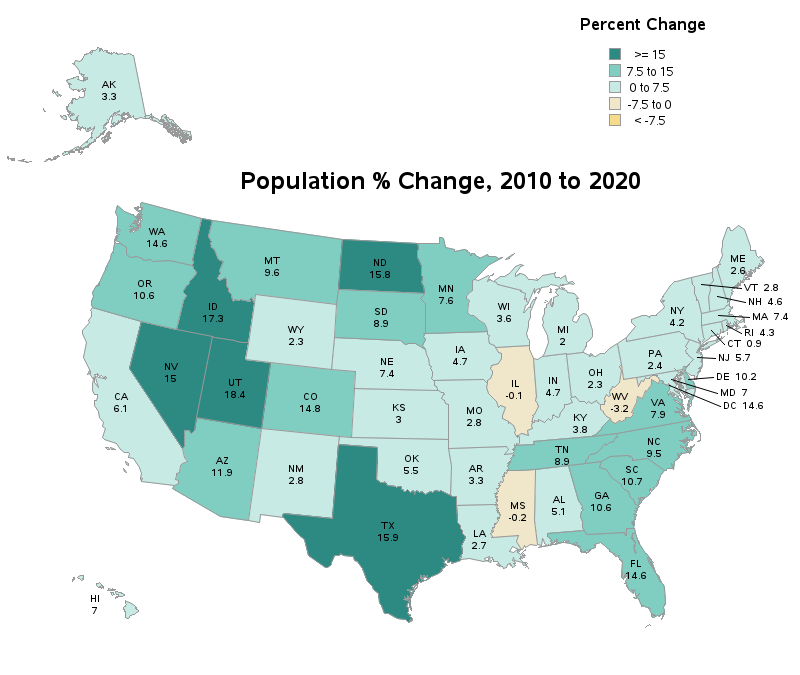
With the 2020 Census numbers starting to come out, it's interesting to look at what states are gaining (or losing) people. In this example, I create a custom map similar to the ones the US Census Bureau likes to use, and plot the 10-year change in population. But before we
Tag: census
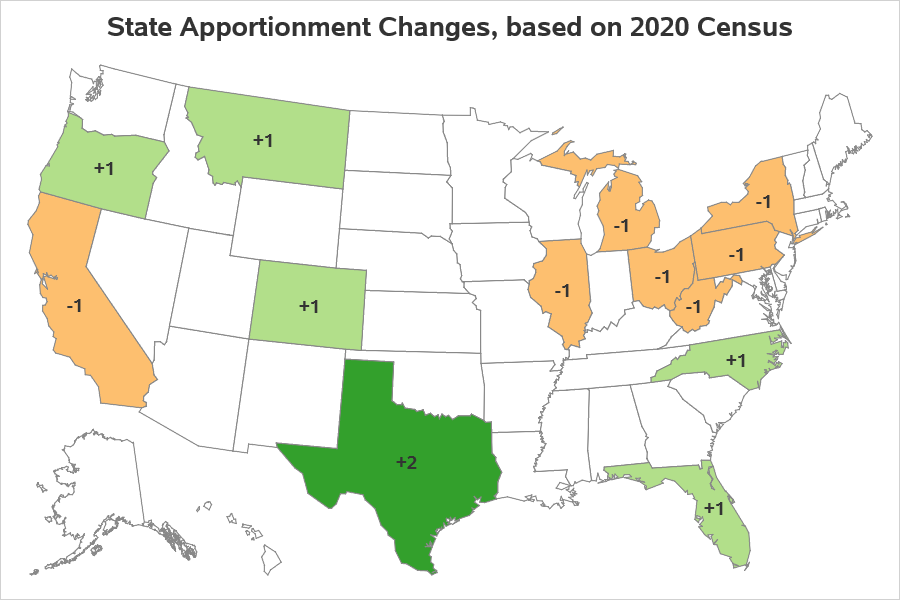
Every 10 years the United States conducts a Census where we count all the people. This week the 2020 Census population totals for each state were released. And how might these numbers affect you? ... One thing the Census numbers are used for is to determine how many of the
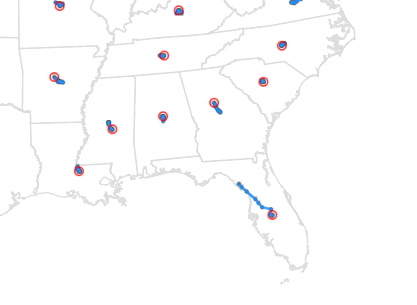
If you have plotted data on a map, you have probably tried to estimate the geographical (or visual) 'center' of map areas, to place labels there. But have you ever given any thought to the "center of population"? This is one of the myriad of statistics the US Census Bureau
I was born in a country (Brazil) where voting is mandatory. Most of my family still lives there, and now that I live in the US, they ask me about American politics all the time. One thing that often catches them by surprise is that not only is voting not
As the 2020 Census approaches, I'm getting my code ready to plot the data! And a question I often hear is "Can you use SAS software to plot data on a Census block map?" Rather than tell you 'yes', let me show you 'yes' :) Preparing the map First I
With the US census coming in 2020, I've decided to sharpen my skills at graphing census data. And today I'm working on creating a population pyramid chart to analyze the age and gender distribution. Follow along if you'd like to see how to create such a chart ... or jump
I've heard many customers ask "Can SAS do/use/handle census block maps?" My answer was "of course!" ... but I never really had any examples to show/prove that. Well, now I do! :) First, you need to locate & download the shape files for the census blocks you're interested in plotting. For